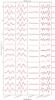
Fig. 13
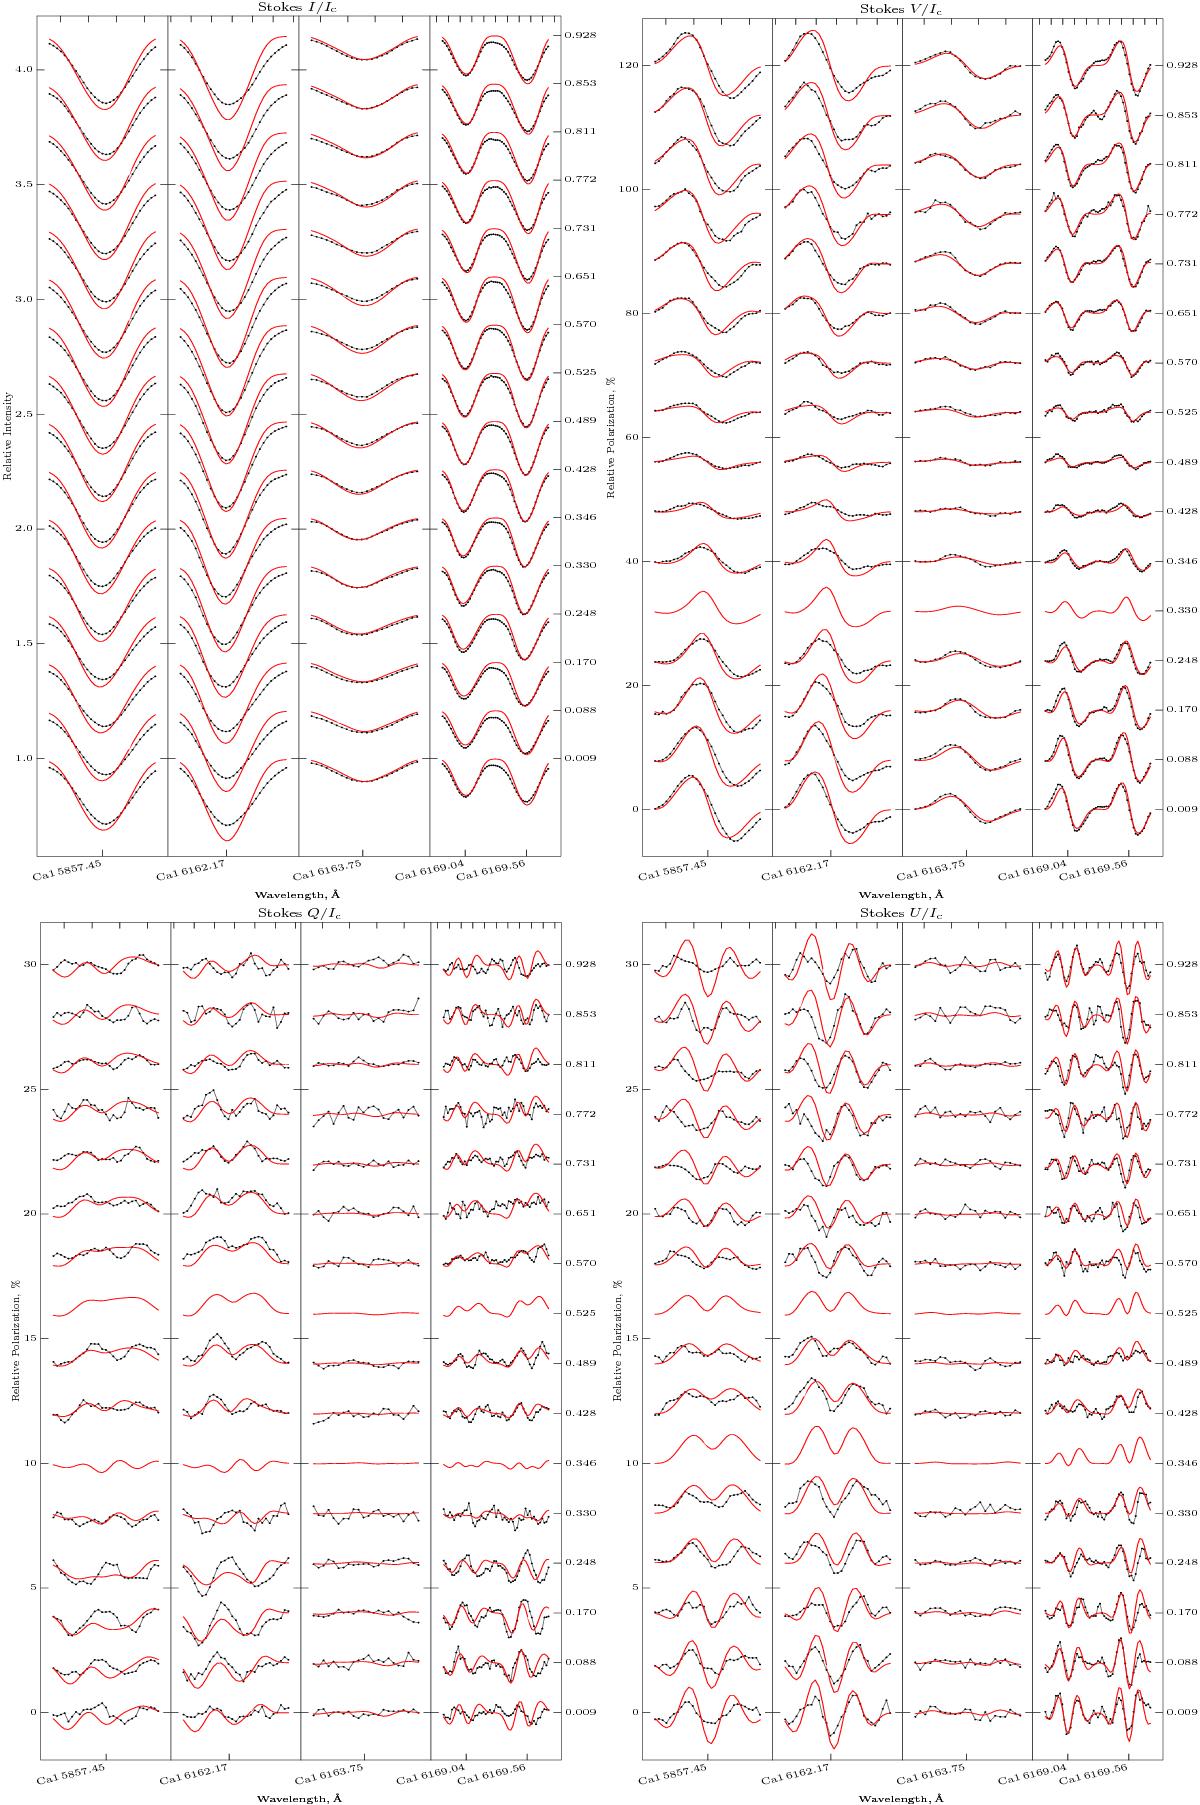
Comparison of the observed (dots connected with lines) and synthetic (lines) Stokes profiles for Ca calculated for the final magnetic field (Fig. 6) and abundance distribution (Fig. 12). The distance between two consecutive ticks on the horizontal top axis of each panel is 0.1 Å, indicating the wavelength scale. Rotational phases are indicated on the right of each panel.
Current usage metrics show cumulative count of Article Views (full-text article views including HTML views, PDF and ePub downloads, according to the available data) and Abstracts Views on Vision4Press platform.
Data correspond to usage on the plateform after 2015. The current usage metrics is available 48-96 hours after online publication and is updated daily on week days.
Initial download of the metrics may take a while.