Fig. 1

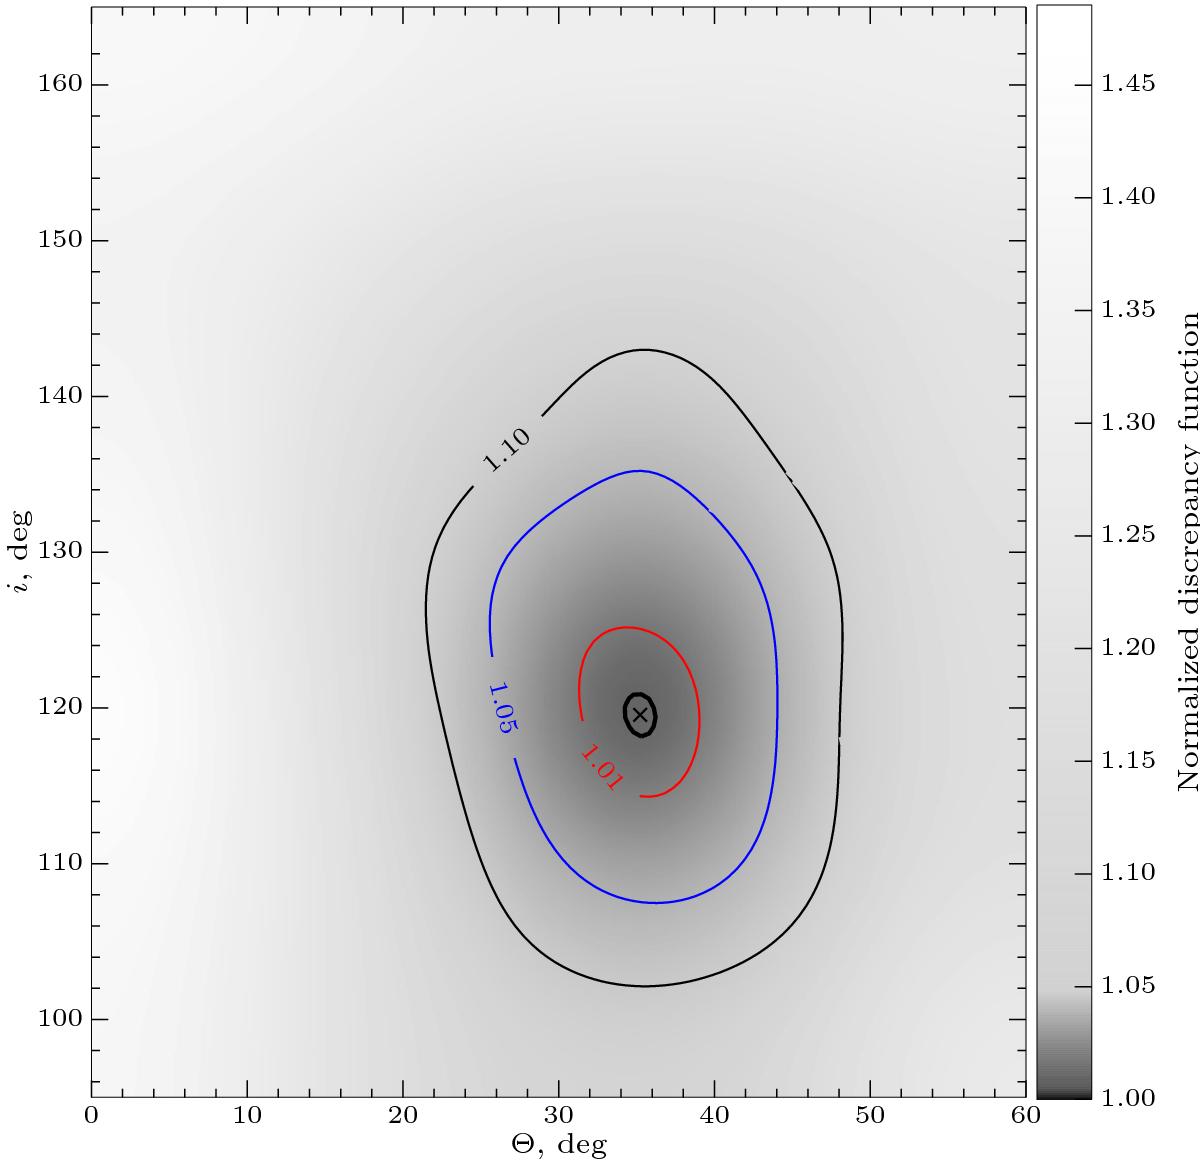
Variations of the normalized discrepancy function for the Stokes QU profiles, ![]() , as a function of inclination angle i and azimuth angle Θ. The innermost unmarked contour plotted with the thick black line corresponds to the five-sigma confidence level of the fit. The other contours marked with 1.01, 1.05, and 1.10 correspond to an increase of 1%, 5%, and 10% of the discrepancy function from its minimum value.
, as a function of inclination angle i and azimuth angle Θ. The innermost unmarked contour plotted with the thick black line corresponds to the five-sigma confidence level of the fit. The other contours marked with 1.01, 1.05, and 1.10 correspond to an increase of 1%, 5%, and 10% of the discrepancy function from its minimum value.
Current usage metrics show cumulative count of Article Views (full-text article views including HTML views, PDF and ePub downloads, according to the available data) and Abstracts Views on Vision4Press platform.
Data correspond to usage on the plateform after 2015. The current usage metrics is available 48-96 hours after online publication and is updated daily on week days.
Initial download of the metrics may take a while.


