Fig. 8
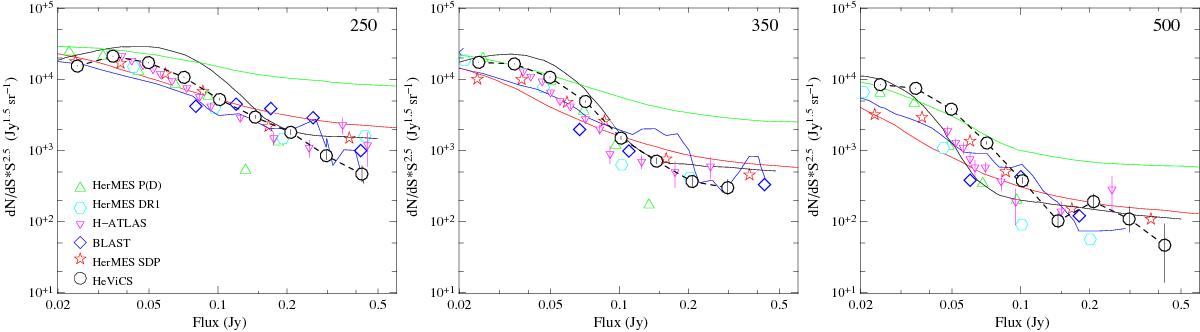
Number counts (black circles) at 250 (left), 350 (middle), and 500 (right) μm. Magenta triangles, red stars, blue diamonds, green triangles, and cyan hexagons show the observations from H-ATLAS (Clements et al. 2010), HerMES SDP (Oliver et al. 2010), BLAST (Patanchon et al. 2009), HerMES DR1 (Béthermin et al. 2012a), and the results of a P(D) (probability of deflection) analysis applied to the HerMES SDP data from Glenn et al. (2010), respectively. The green, black, blue, and red solid lines show the models of Lacey et al. (2010), Negrello et al. (2007), Valiante et al. (2009), and Béthermin et al. (2012b).
Current usage metrics show cumulative count of Article Views (full-text article views including HTML views, PDF and ePub downloads, according to the available data) and Abstracts Views on Vision4Press platform.
Data correspond to usage on the plateform after 2015. The current usage metrics is available 48-96 hours after online publication and is updated daily on week days.
Initial download of the metrics may take a while.