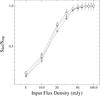
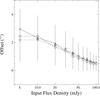
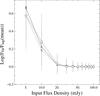
Fig. 4
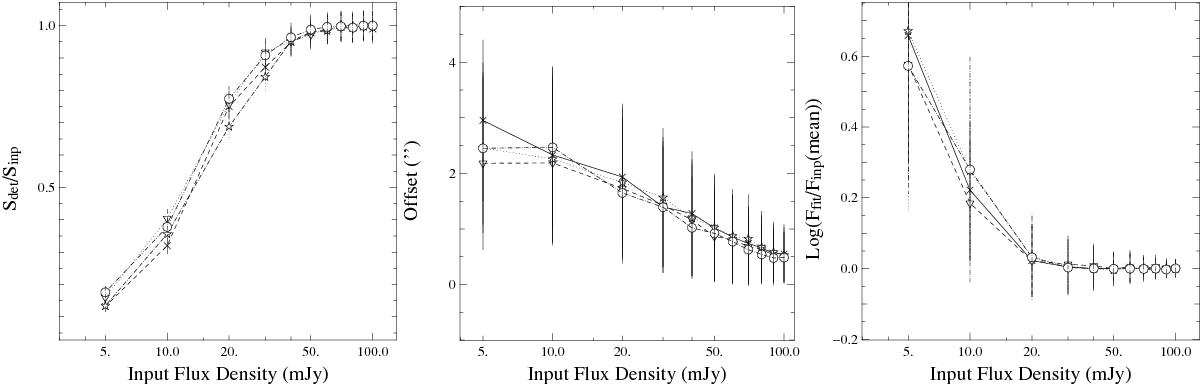
Completeness and flux-position accuracy in the catalog at 250 μm. In each panel, the field V1, V2, V3, and V4 are shown as solid, dashed, dotted, and dash-dotted line. Left panel: ratio between the numbers of objects detected and the number of sources injected. Middle panel: radial offset between the sources injected and the source recovered as a function of the input flux density. Right panel: logarithm of the ratio between the average recovered flux density and the input one, as a function of the injected fluxes.
Current usage metrics show cumulative count of Article Views (full-text article views including HTML views, PDF and ePub downloads, according to the available data) and Abstracts Views on Vision4Press platform.
Data correspond to usage on the plateform after 2015. The current usage metrics is available 48-96 hours after online publication and is updated daily on week days.
Initial download of the metrics may take a while.