Free Access
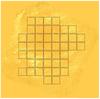
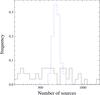
Fig. 3
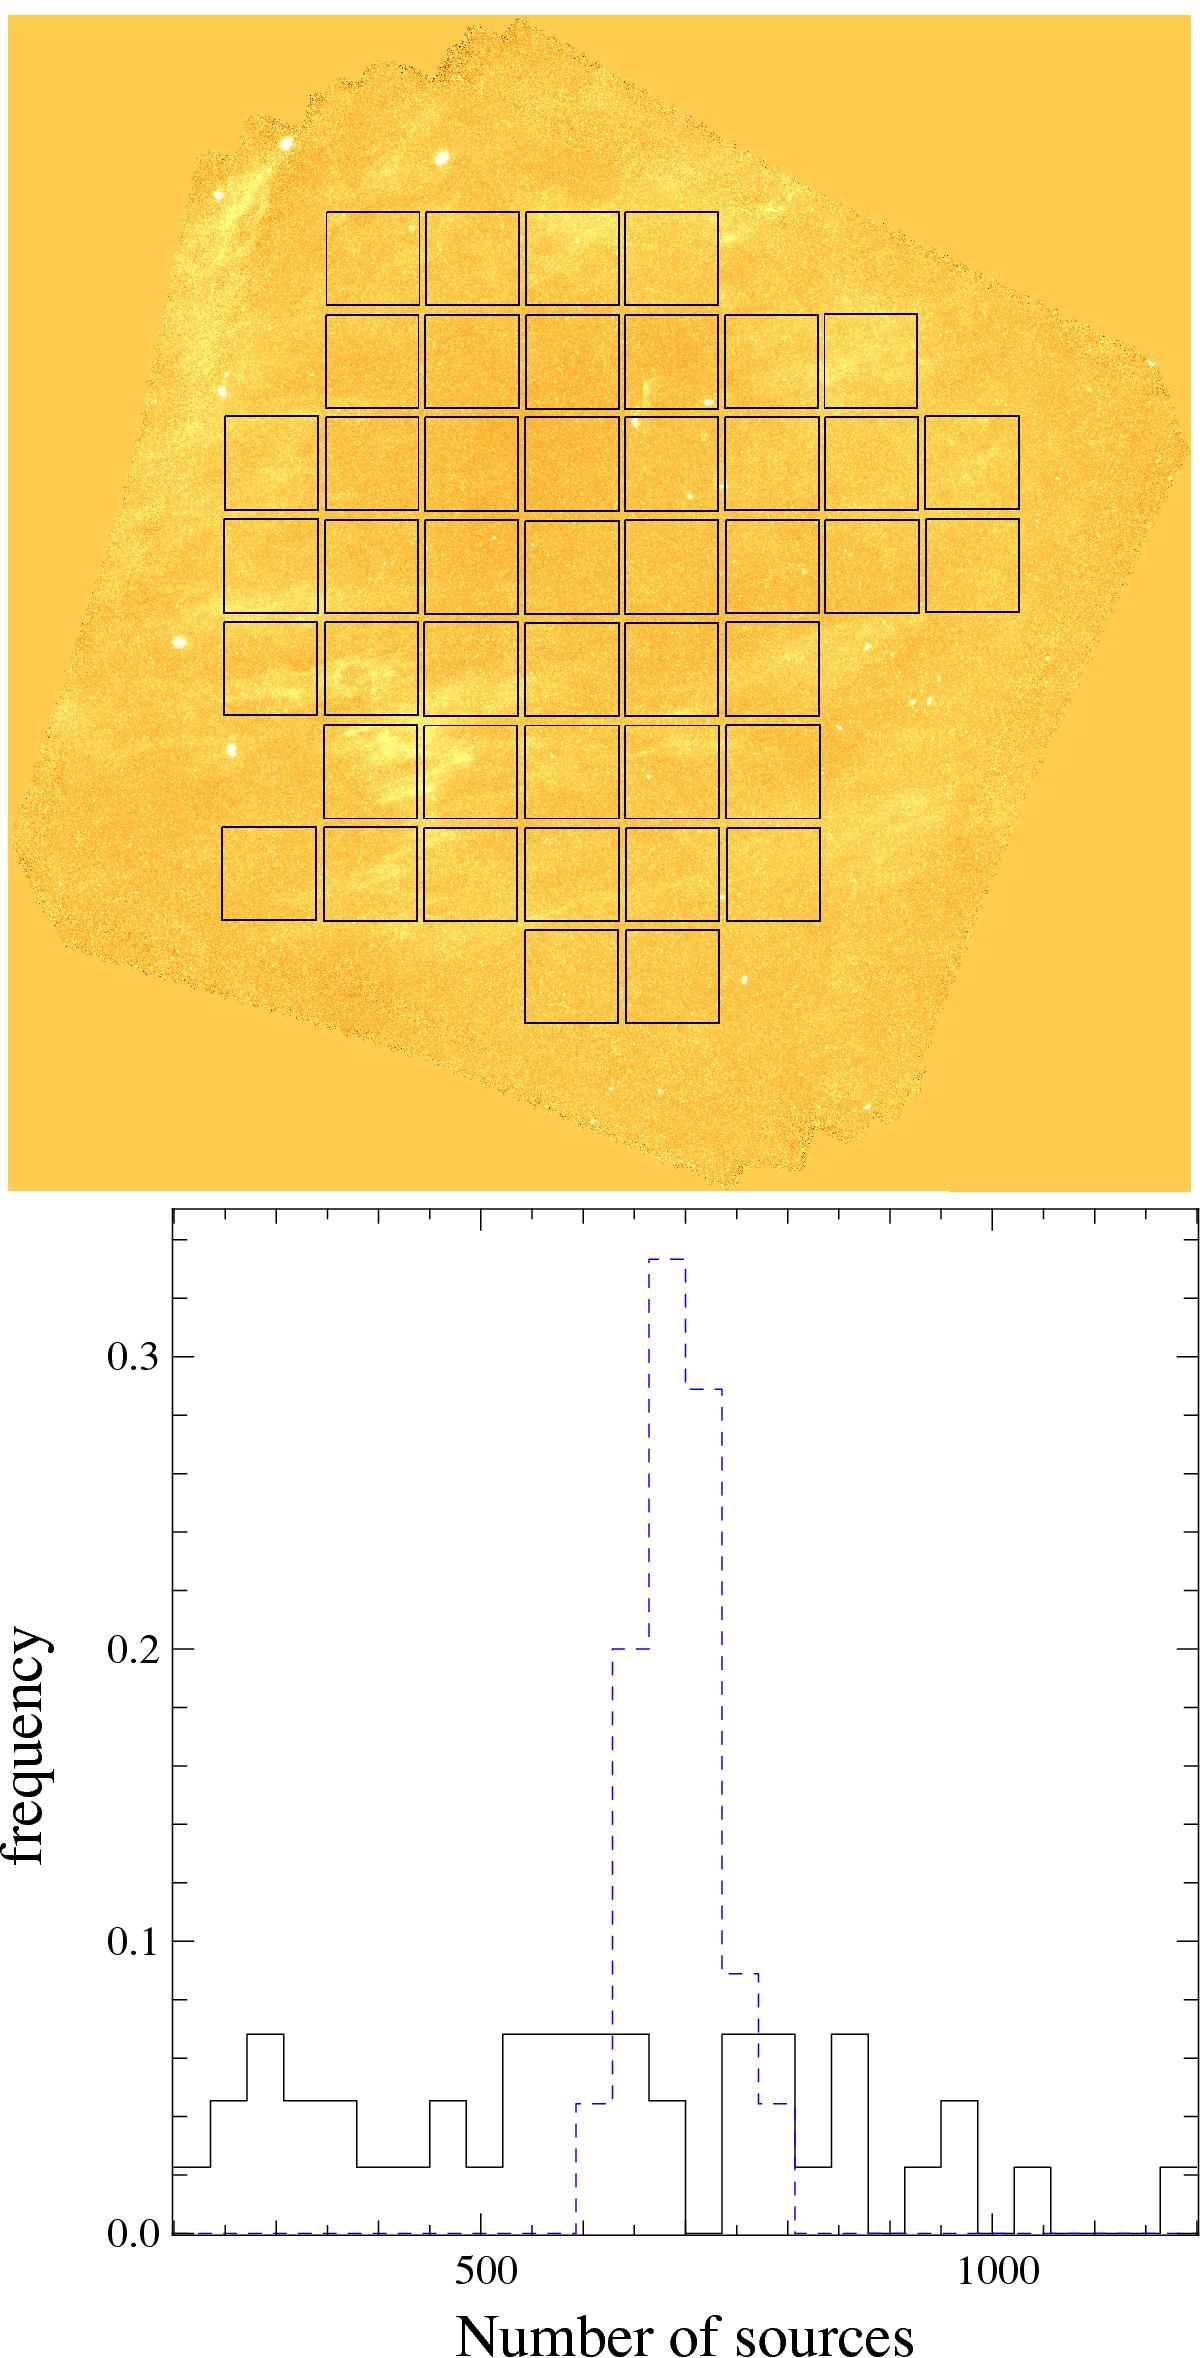
Top panel: boxes used in V2 field to test cirrus subtraction. Bottom panel: distribution of the number of sources detected in the V2 boxes shown in the top panel before (black solid line) and after (blue dashed line) background subtraction.
This figure is made of several images, please see below:
Current usage metrics show cumulative count of Article Views (full-text article views including HTML views, PDF and ePub downloads, according to the available data) and Abstracts Views on Vision4Press platform.
Data correspond to usage on the plateform after 2015. The current usage metrics is available 48-96 hours after online publication and is updated daily on week days.
Initial download of the metrics may take a while.