Fig. 3
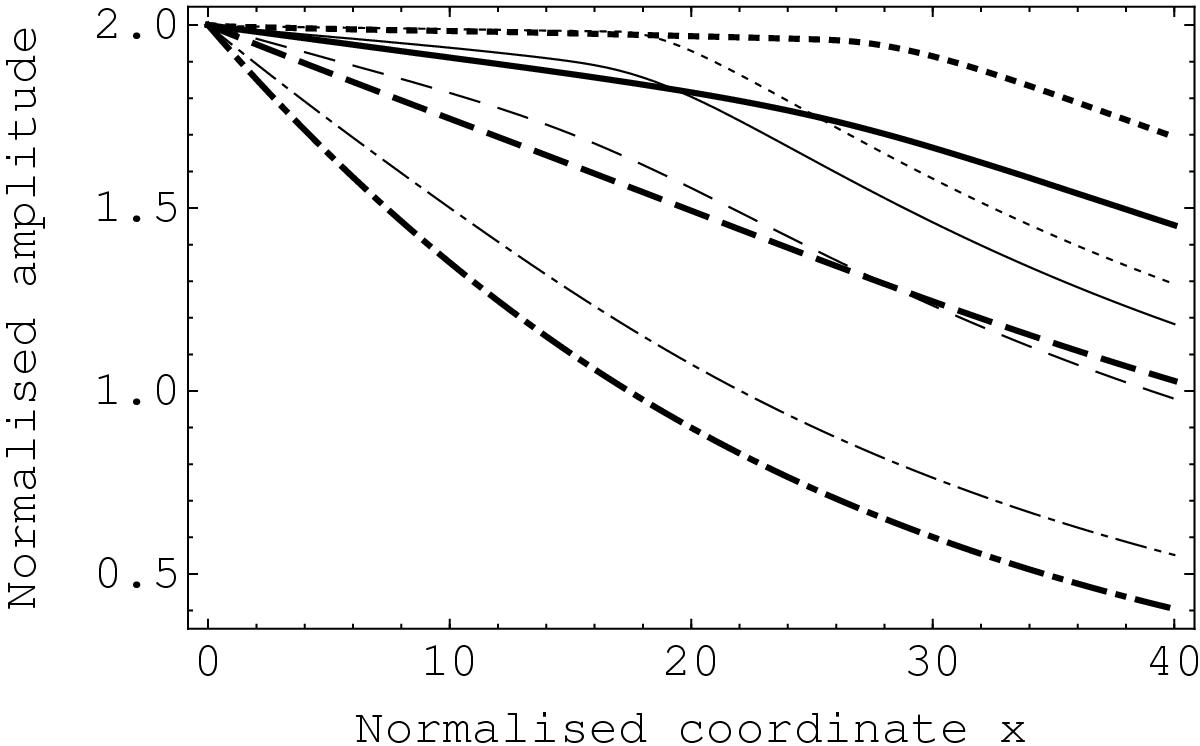
Evolution of the tube wave amplitude with the distance ![]() along the plume for different values of the effective viscosity (thick lines). The dotted, solid, dashed, and dash-dotted lines correspond to the viscosity of 4.0 × 1013,2.4 × 1014,7.0 × 1014, and 2.0 × 1015 cm2 s-1, respectively. Here VA = 130 km s-1, c0 = 175 km s-1, and the wave period is 600 s. The thin lines correspond to plane sound waves.
along the plume for different values of the effective viscosity (thick lines). The dotted, solid, dashed, and dash-dotted lines correspond to the viscosity of 4.0 × 1013,2.4 × 1014,7.0 × 1014, and 2.0 × 1015 cm2 s-1, respectively. Here VA = 130 km s-1, c0 = 175 km s-1, and the wave period is 600 s. The thin lines correspond to plane sound waves.
Current usage metrics show cumulative count of Article Views (full-text article views including HTML views, PDF and ePub downloads, according to the available data) and Abstracts Views on Vision4Press platform.
Data correspond to usage on the plateform after 2015. The current usage metrics is available 48-96 hours after online publication and is updated daily on week days.
Initial download of the metrics may take a while.