Fig. 4
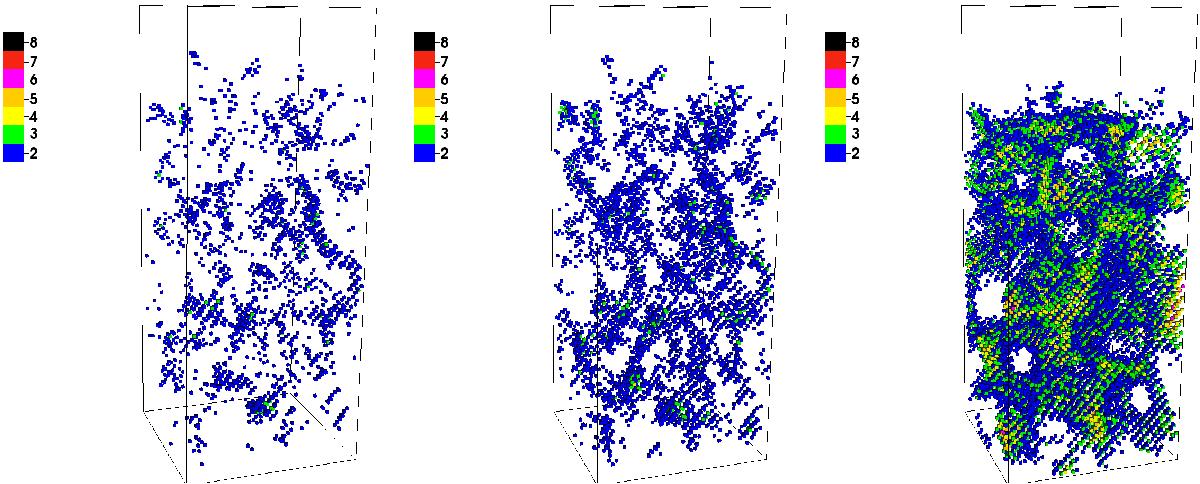
Distribution of the pores in a 60×60×150 grid at 10 K (left), 60 K (middle), and 100 K (right). The temperature is initially set at 10 K, and is increased at a rate of 2 K/min to mimic laboratory conditions. Each dot shows an empty space with a tag n (colour scale) corresponding to the number of empty cells in a radius n around the cell n. This figure is the negative image of Fig. 3.
Current usage metrics show cumulative count of Article Views (full-text article views including HTML views, PDF and ePub downloads, according to the available data) and Abstracts Views on Vision4Press platform.
Data correspond to usage on the plateform after 2015. The current usage metrics is available 48-96 hours after online publication and is updated daily on week days.
Initial download of the metrics may take a while.