Free Access
Fig. 5
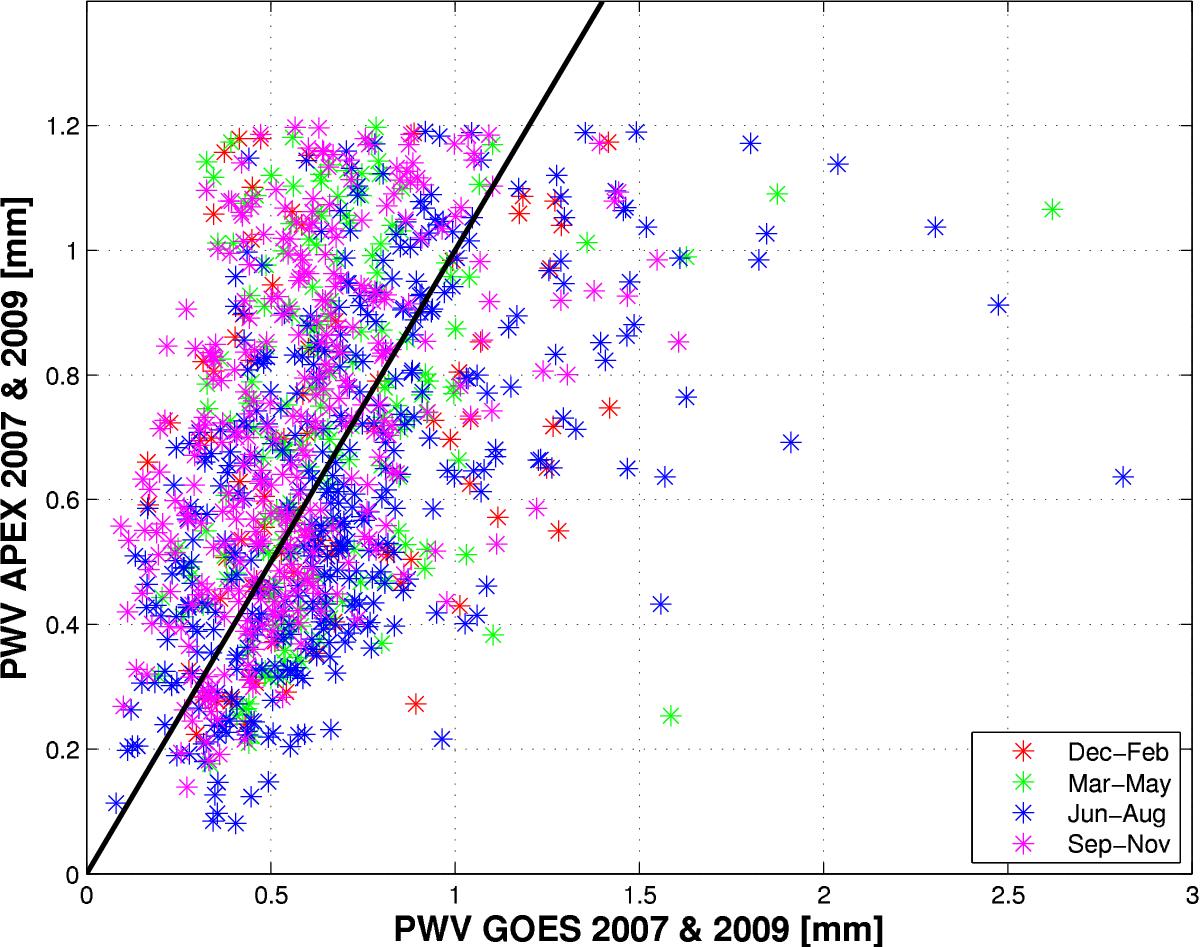
Scatter plot between the PWV_GF and the PWV_A for 2007 and 2009 for the observed PWV range 0–1.2 mm. The color stars represent PWV values for each of the four seasons of the year (southern hemisphere). See legend for details. Also shown in the plot is the line 1:1.
Current usage metrics show cumulative count of Article Views (full-text article views including HTML views, PDF and ePub downloads, according to the available data) and Abstracts Views on Vision4Press platform.
Data correspond to usage on the plateform after 2015. The current usage metrics is available 48-96 hours after online publication and is updated daily on week days.
Initial download of the metrics may take a while.