Free Access
Fig. 10
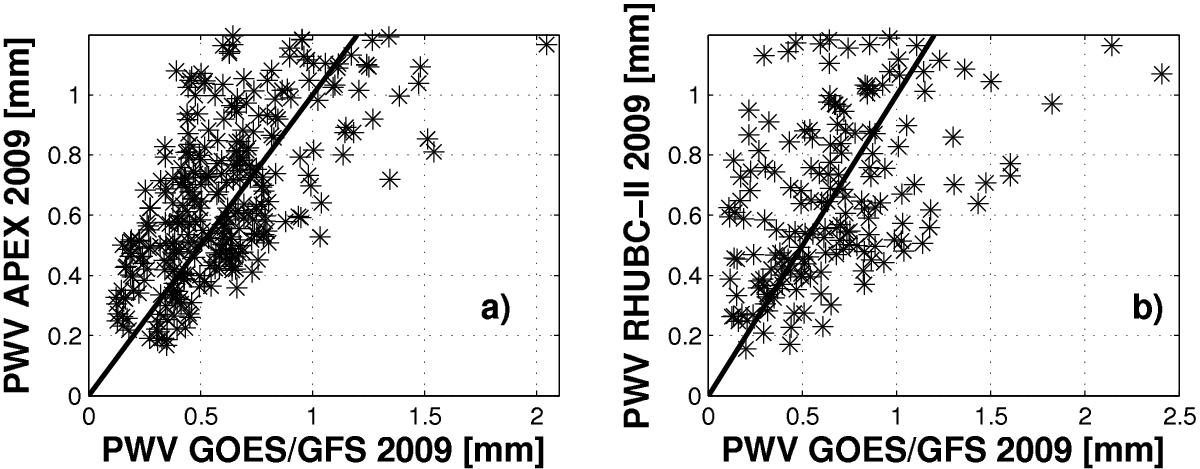
Scatter plot between the PWV estimated from GOES/GFS and observations at a) APEX and b) the RHUBC-II site for the range 0–1.2 mm from 15 August to 25 October 2009 (the RHUBC-II period).
Current usage metrics show cumulative count of Article Views (full-text article views including HTML views, PDF and ePub downloads, according to the available data) and Abstracts Views on Vision4Press platform.
Data correspond to usage on the plateform after 2015. The current usage metrics is available 48-96 hours after online publication and is updated daily on week days.
Initial download of the metrics may take a while.