Fig. 6
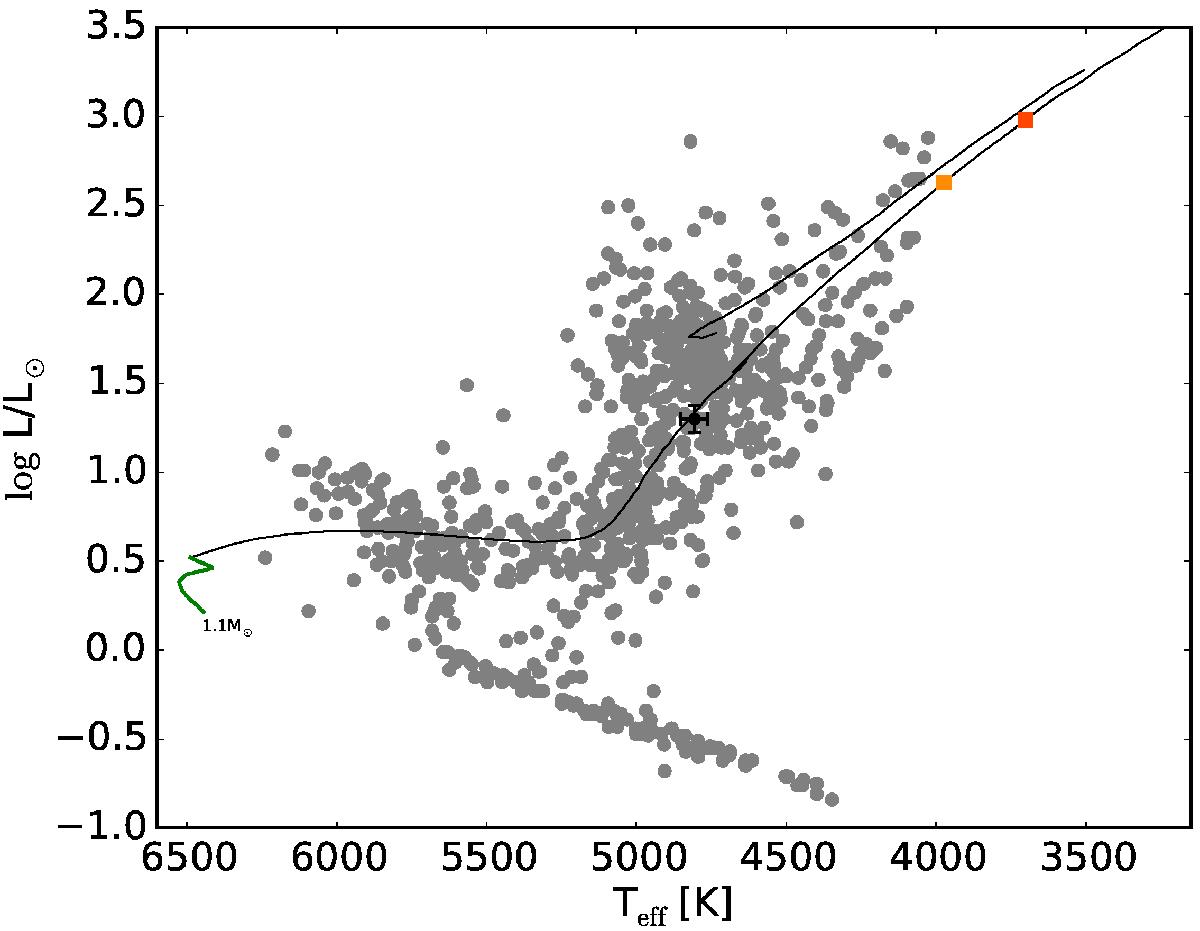
Hertzsprung-Russel diagram for the complete PTPS sample with TYC 1422-614-1 position indicated and 1.1 M⊙, z = 0.008 stellar evolutionary track from Bertelli et al. (2008) and, in green, the path of the star with planet c within the optimistic HZ of Kopparapu et al. (2013). The orange and red rectangles indicate the phase of planet b and c ingestion.
Current usage metrics show cumulative count of Article Views (full-text article views including HTML views, PDF and ePub downloads, according to the available data) and Abstracts Views on Vision4Press platform.
Data correspond to usage on the plateform after 2015. The current usage metrics is available 48-96 hours after online publication and is updated daily on week days.
Initial download of the metrics may take a while.