Fig. 9
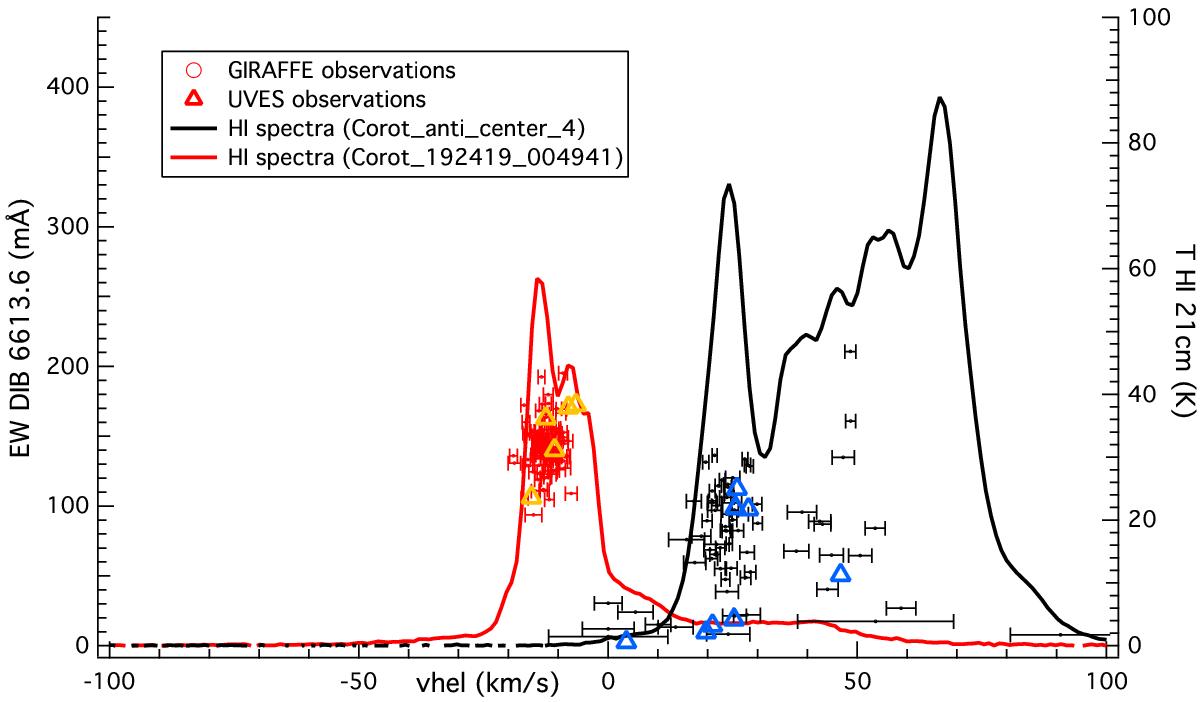
Comparison between the fitted DIB radial velocities and EWs and the HI 21 cm emission spectra. Black (red) markers and lines are GIRAFFE results and HI spectra from field 1 (field 2). Error bars on the velocities are based on the full covariance matrix for the various parameters. For the narrow 6614 Å DIB (GIRAFFE observations) a significant number of spectra require two velocity components, which very likely correspond to the Local and Perseus arms. Small EWs and large error bars on velocities correspond to marginal results in low S/N spectra. UVES target results are displayed with triangles (yellow and blue for fields 1 and 2). At variance with GIRAFFE, UVES velocities are linked to the strong sodium lines through global fitting. Their agreement with the velocity structure derived from the GIRAFFE targets shows the link between NaI and DIB velocities.
Current usage metrics show cumulative count of Article Views (full-text article views including HTML views, PDF and ePub downloads, according to the available data) and Abstracts Views on Vision4Press platform.
Data correspond to usage on the plateform after 2015. The current usage metrics is available 48-96 hours after online publication and is updated daily on week days.
Initial download of the metrics may take a while.