Fig. 8
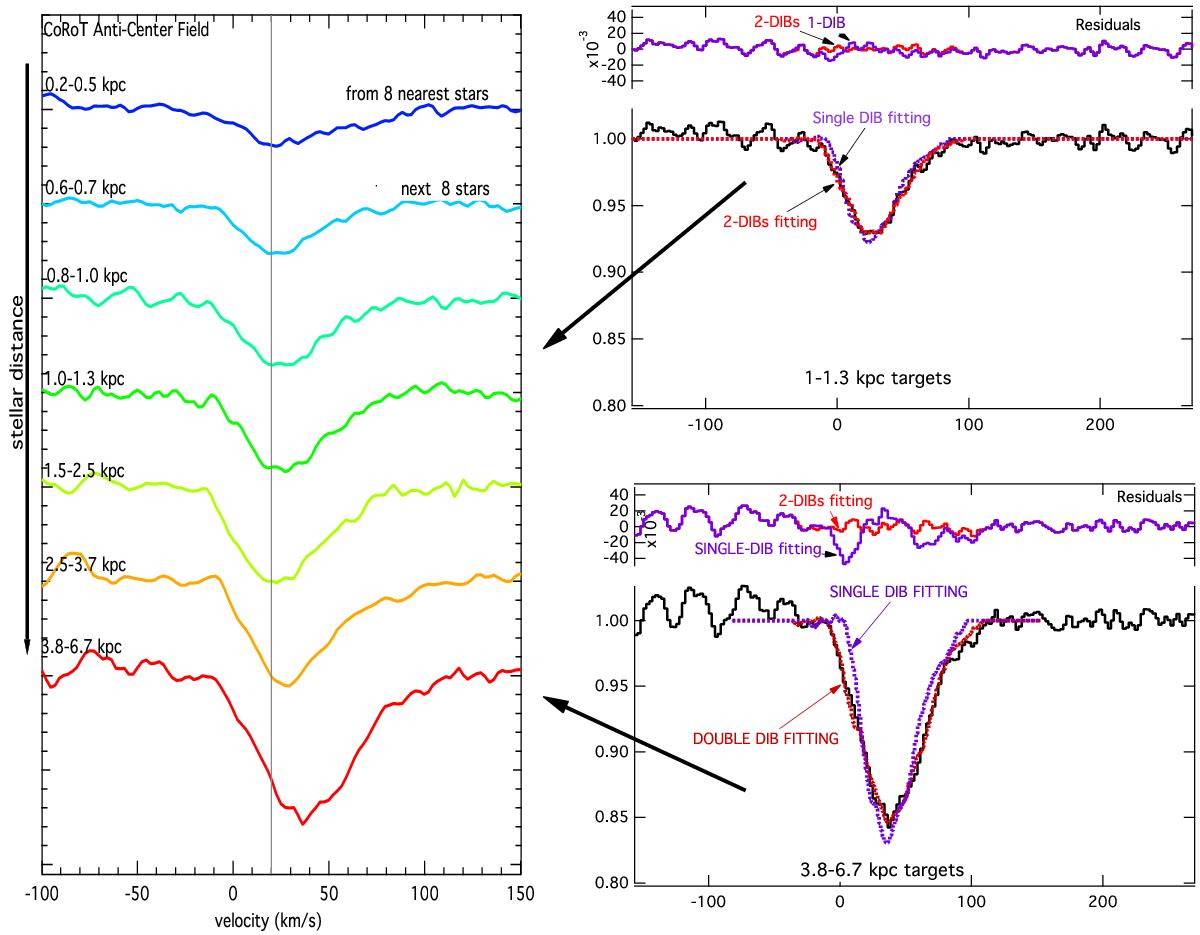
Evolution of the DIB profile with target distance. Left: the 6614Å DIB absorption spectral profile up to stars at increasing distances along the CoRoT anticentre direction (l, b = 213°, −2°). We show the average of stacked extracted, normalized absorption spectra sorted by stellar distances (an offset of 0.5 in y-axis separates the two spectra). The continuum on the blue side of the DIB is affected by strong stellar lines that are insufficiently corrected for. The first (top) spectrum corresponds to the first kpc, the last (bottom) spectrum to distances between 4 and 6 kpc. Right: comparisons between one- and two-DIB component adjustments for close and distant stars. Distant stars require at least two DIBs separated by more than 20 km s-1 (see text).
Current usage metrics show cumulative count of Article Views (full-text article views including HTML views, PDF and ePub downloads, according to the available data) and Abstracts Views on Vision4Press platform.
Data correspond to usage on the plateform after 2015. The current usage metrics is available 48-96 hours after online publication and is updated daily on week days.
Initial download of the metrics may take a while.