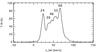
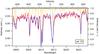
Fig. 4
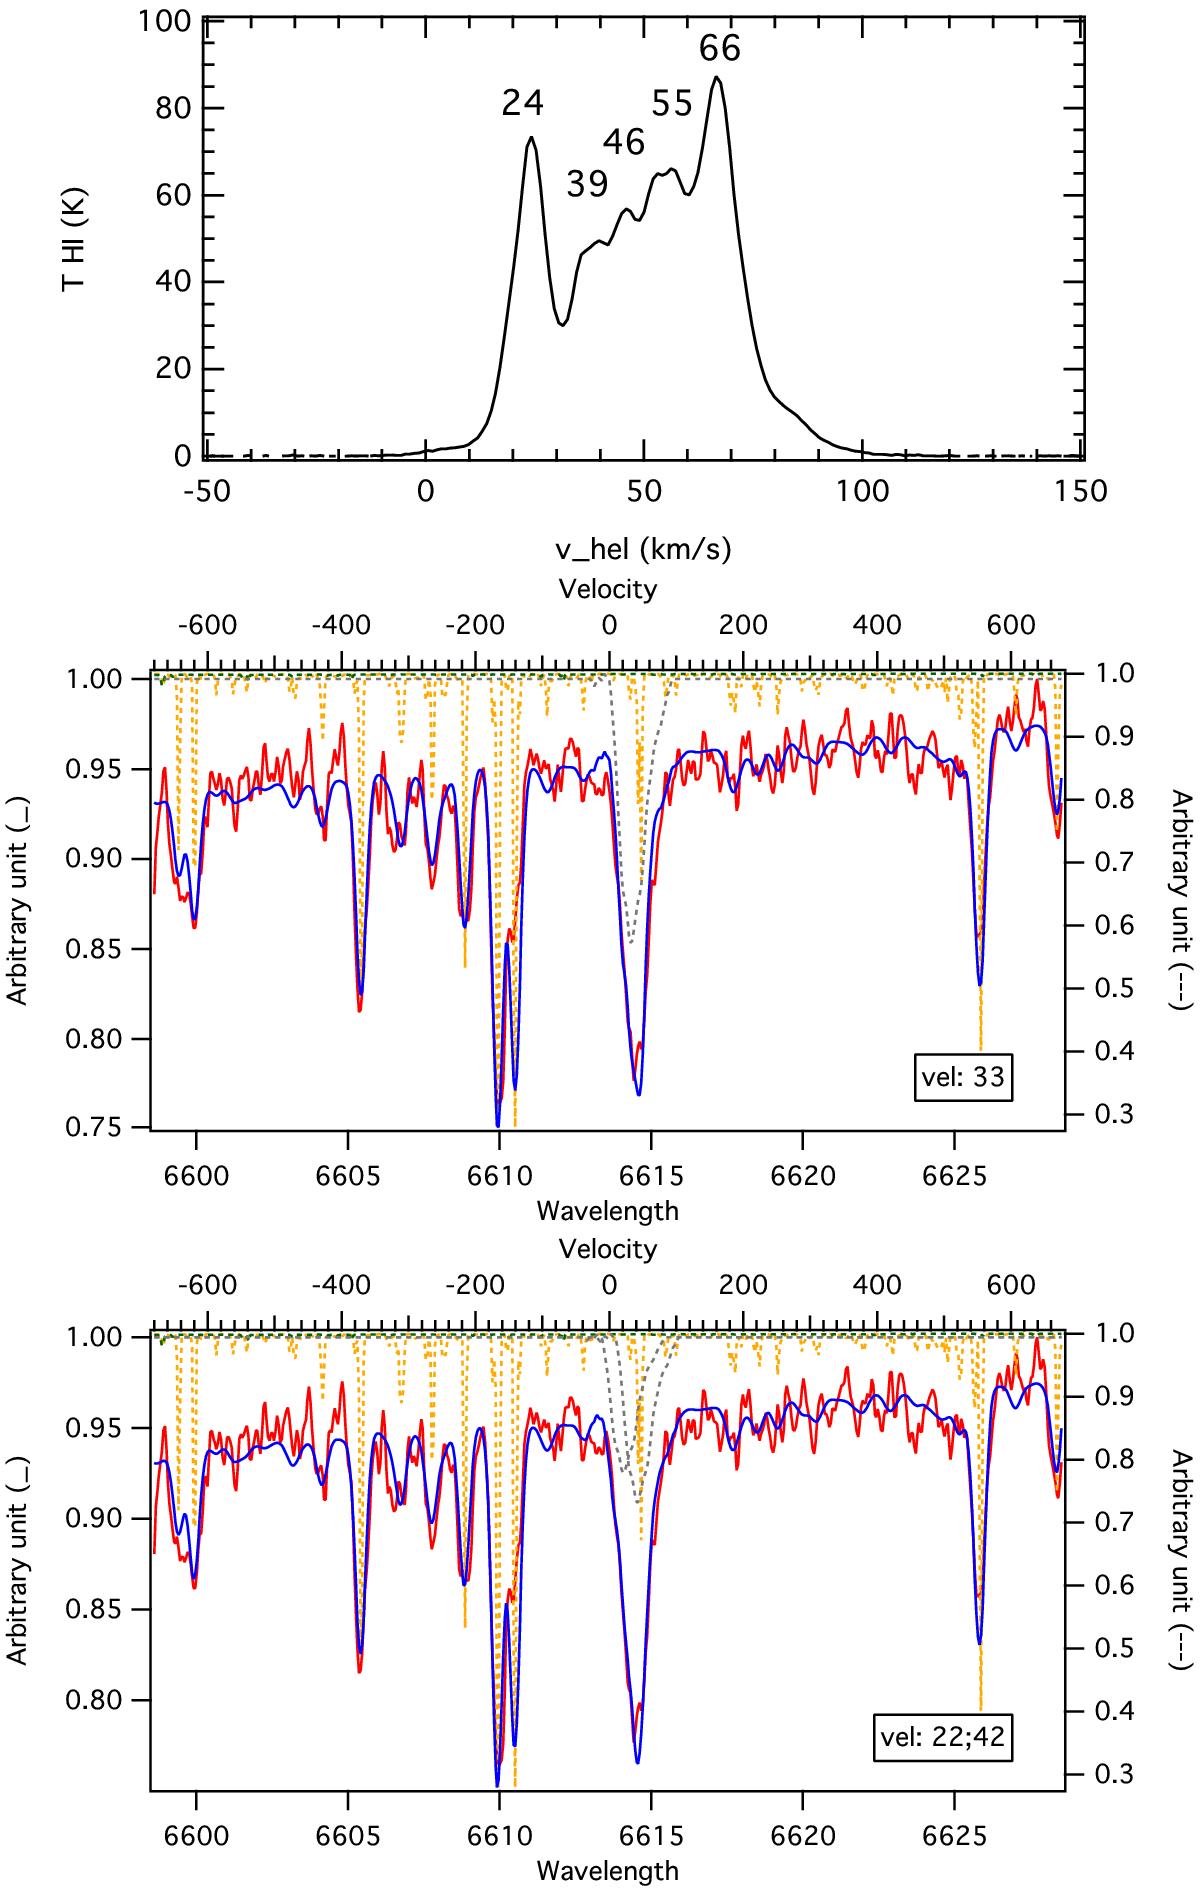
Multicomponent 6614 Å DIB fitting: GIRAFFE field 1, GES target 06441034-0048254. The red line shows the stellar spectrum. The dotted lines are the models: stellar (orange), telluric (green), empirical DIBs (gray). The thick blue line is the best model adjustment. The initial guesses for the DIB velocity centroids are 24, 40, and 50 km s-1 and are based on the HI spectrum in the same direction (see top plot). Middle: an example of a preliminary adjustment with a unique DIB component. The DIB velocity is found to be ~33 km s-1. The large difference from the initial guess (24 km s-1) demonstrates the need for a second cloud component. Bottom: an example of a subsequent adjustment with two DIB components. The two fitted velocities are now close to the first two HI emission peaks.
Current usage metrics show cumulative count of Article Views (full-text article views including HTML views, PDF and ePub downloads, according to the available data) and Abstracts Views on Vision4Press platform.
Data correspond to usage on the plateform after 2015. The current usage metrics is available 48-96 hours after online publication and is updated daily on week days.
Initial download of the metrics may take a while.