Free Access
Fig. A.2
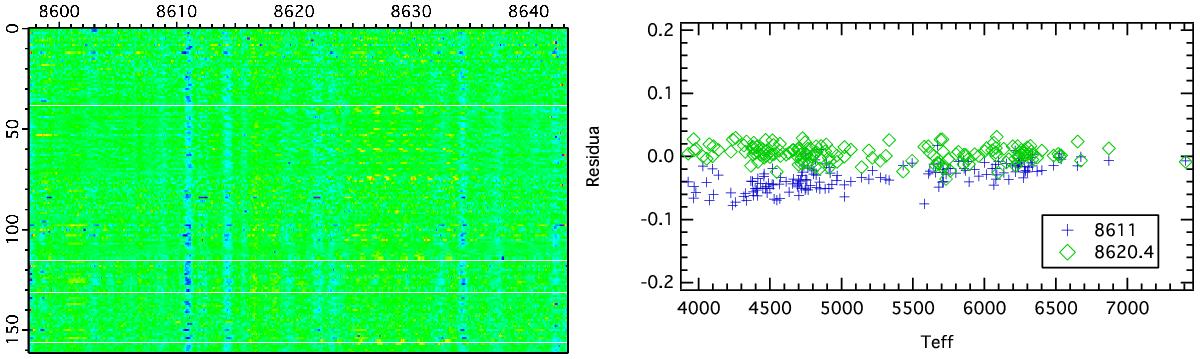
Same as Fig. A.1, but for 8620 DIB. Left: fit residuals for all of target stars over the entire wavelength range. Right: the residuals at chosen wavelengths. The 8611 Å region shows higher negative residuals because the model underestimates the stellar line in this area.
This figure is made of several images, please see below:
Current usage metrics show cumulative count of Article Views (full-text article views including HTML views, PDF and ePub downloads, according to the available data) and Abstracts Views on Vision4Press platform.
Data correspond to usage on the plateform after 2015. The current usage metrics is available 48-96 hours after online publication and is updated daily on week days.
Initial download of the metrics may take a while.