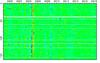
Fig. A.1
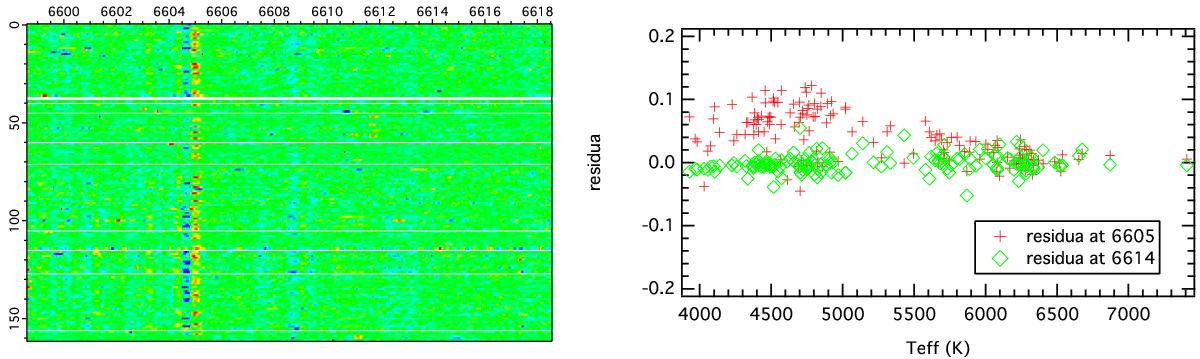
Left: fit residuals (the difference between the data spectrum and the fitted model) for all of target stars in the CoRoT fields observed by GIRAFFE (6613.6 Å DIB). The left axis is the star stacking axis and the top axis is the wavelength (after spectra have all been shifted to their respective stellar frames). The color shows the residual intensity. Zero value (green) corresponds to well-fitted spectra. The residual (red and blue for positive and negative residuals) is due to imperfect stellar modeling. Right: the residuals at chosen wavelengths: at ~6605 Å (shown as red marks) and at ~6614 Å (shown in green). The ~6605 Å region shows higher positive residuals because the model overestimates the stellar line in this area. At 6614 Å, we have fit residuals about 0.
Current usage metrics show cumulative count of Article Views (full-text article views including HTML views, PDF and ePub downloads, according to the available data) and Abstracts Views on Vision4Press platform.
Data correspond to usage on the plateform after 2015. The current usage metrics is available 48-96 hours after online publication and is updated daily on week days.
Initial download of the metrics may take a while.