Fig. 2
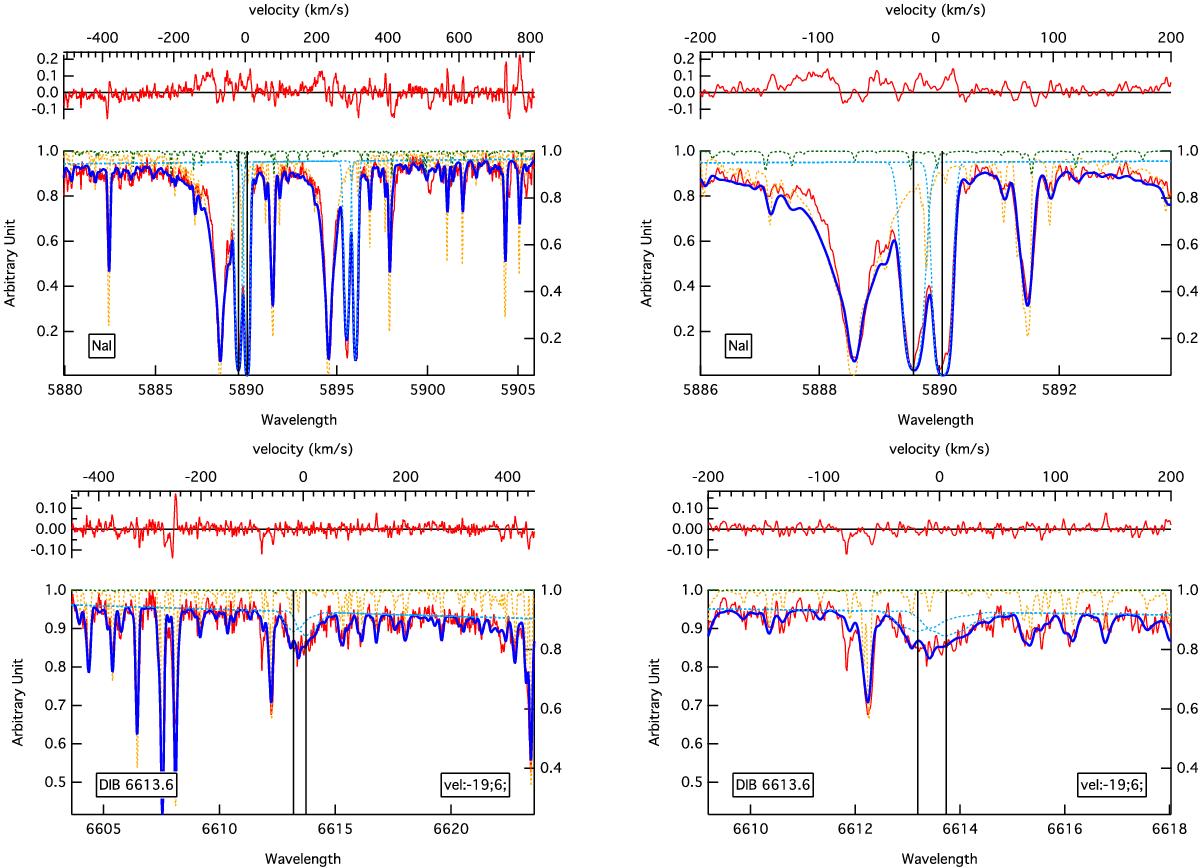
NaI doublet/6614 Å DIB global, multicomponent analysis, here for the GES star 12574905-6458511 (field 3). The NaI region is shown in the top panel and the DIB region in the lower panel. The entire fitted spectral interval is shown in the left panels, while the right panels display enlarged the NaI-D2 region (top) and the DIB region (lower). In each figure the red line shows the stellar spectrum (lower plot) and the fitting residuals (upper plot). The dotted lines are the models: stellar (orange), telluric (green), and interstellar components (blue). The thick blue line is the final adjustment. The radial velocities of the NaI and DIB components are linked throughout (see the black vertical line). Velocities are heliocentric.
Current usage metrics show cumulative count of Article Views (full-text article views including HTML views, PDF and ePub downloads, according to the available data) and Abstracts Views on Vision4Press platform.
Data correspond to usage on the plateform after 2015. The current usage metrics is available 48-96 hours after online publication and is updated daily on week days.
Initial download of the metrics may take a while.