Free Access
Fig. 1
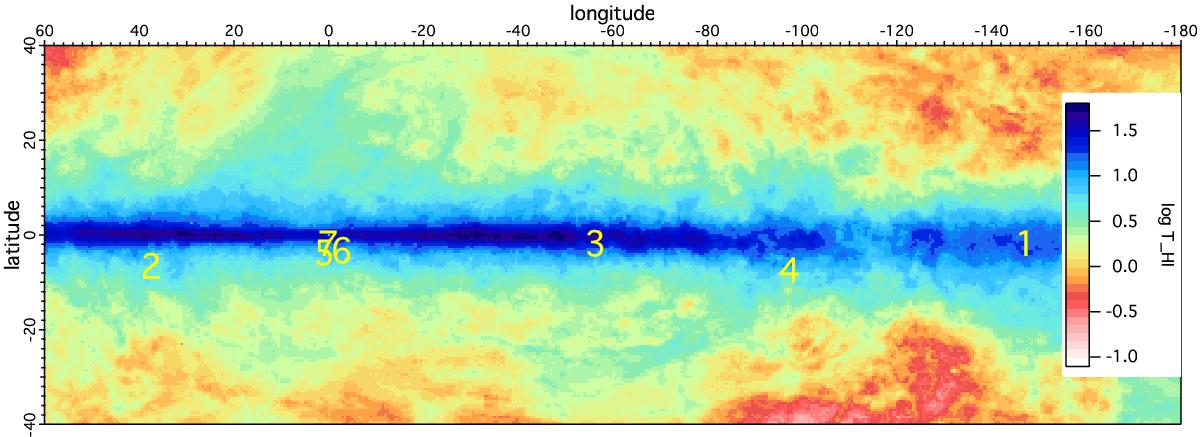
Distribution of the selected fields, numbered as in Table 1. The distribution is superimposed on the HI 21 cm brightness temperature map (Kalberla et al. 2005) in the radial velocity interval −100 km s-1≤ vLSR ≤ 100 km s-1. The map is in Galactic coordinates, centered on l = −60°.
Current usage metrics show cumulative count of Article Views (full-text article views including HTML views, PDF and ePub downloads, according to the available data) and Abstracts Views on Vision4Press platform.
Data correspond to usage on the plateform after 2015. The current usage metrics is available 48-96 hours after online publication and is updated daily on week days.
Initial download of the metrics may take a while.