Fig. 11
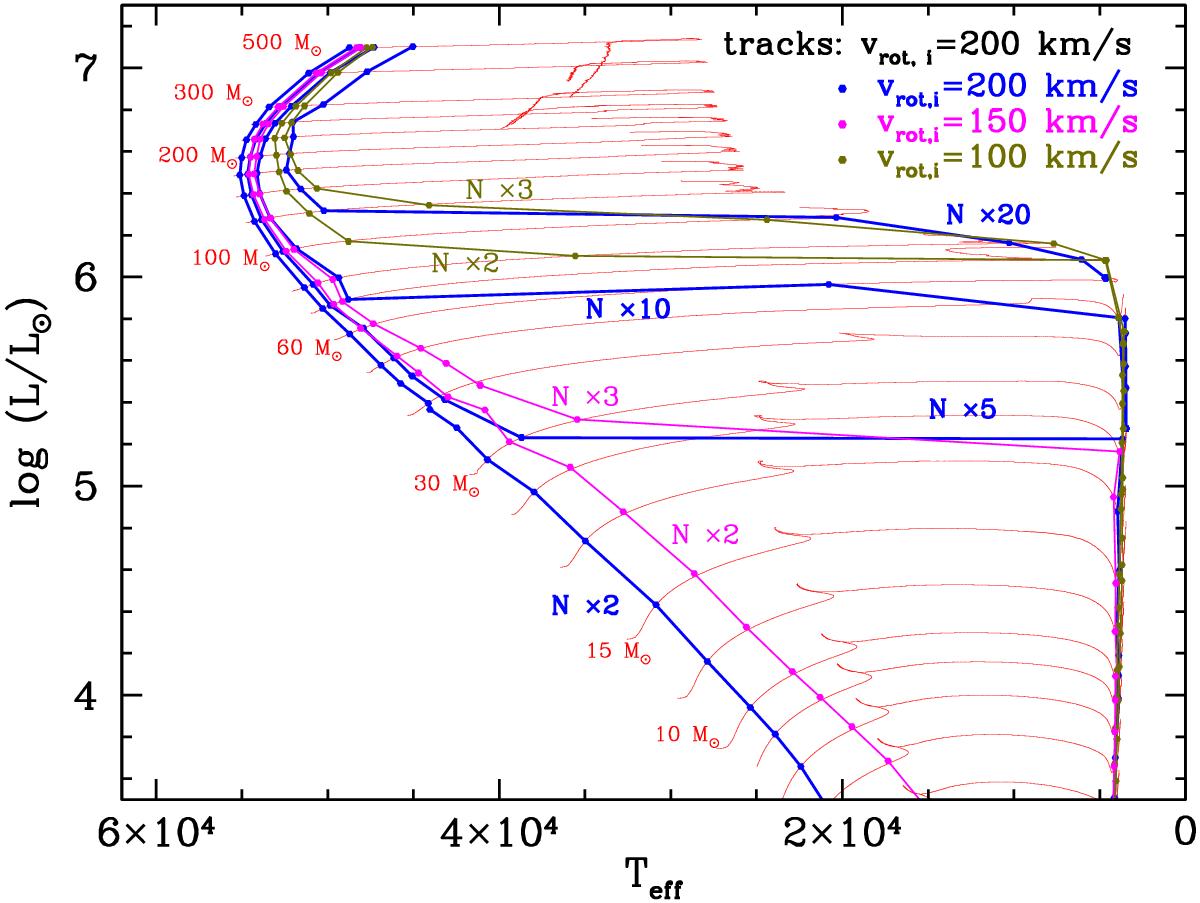
Evolutionary tracks in the HR diagram of stellar models initially rotating with approximately 200 km s-1, and with initial masses of 6, 7, 8, 9, 10, 12, 15, 20, 25, 30, 40, 50, 60, 70, 80, 100, 125, 150, 175, 200, 230, 260, 300, 400, and 500 M⊙. Overlaid are lines (in blue) of constant nitrogen surface mass fraction, corresponding to nitrogen enhancement factors of 2, 5, 10, and 20, as indicated in blue. Lines of constant nitrogen enhancement factors of 2 and 3 corresponding to models with approximate initial rotational velocities of 150 and 100 km s-1 are also shown.
Current usage metrics show cumulative count of Article Views (full-text article views including HTML views, PDF and ePub downloads, according to the available data) and Abstracts Views on Vision4Press platform.
Data correspond to usage on the plateform after 2015. The current usage metrics is available 48-96 hours after online publication and is updated daily on week days.
Initial download of the metrics may take a while.