Fig. 7
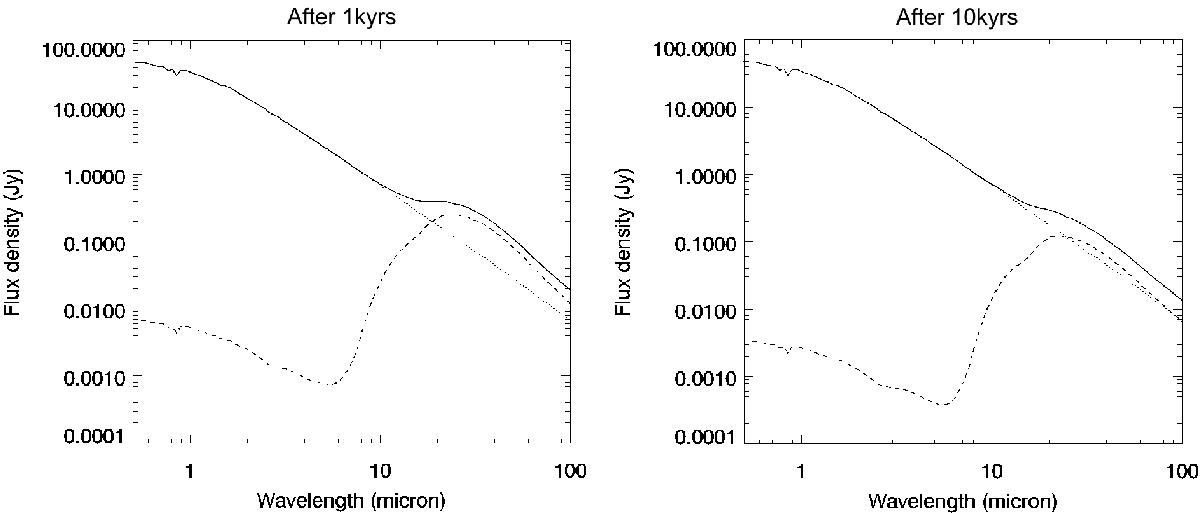
SED of the integrated system, as estimated with the GRaTer package at 1 (left) and 10 kyrs (right) after the breakup. The full line represents the total (stellar photosphere + disc) luminosity, while the dashed line represents the sole contribution of the dust disc and the dotted one is that of the stellar photosphere. The scattered light contribution to the disc SED, which dominates thermal emission at short wavelengths, has been calculated assuming isotropic scattering.

Current usage metrics show cumulative count of Article Views (full-text article views including HTML views, PDF and ePub downloads, according to the available data) and Abstracts Views on Vision4Press platform.
Data correspond to usage on the plateform after 2015. The current usage metrics is available 48-96 hours after online publication and is updated daily on week days.
Initial download of the metrics may take a while.