Fig. 2
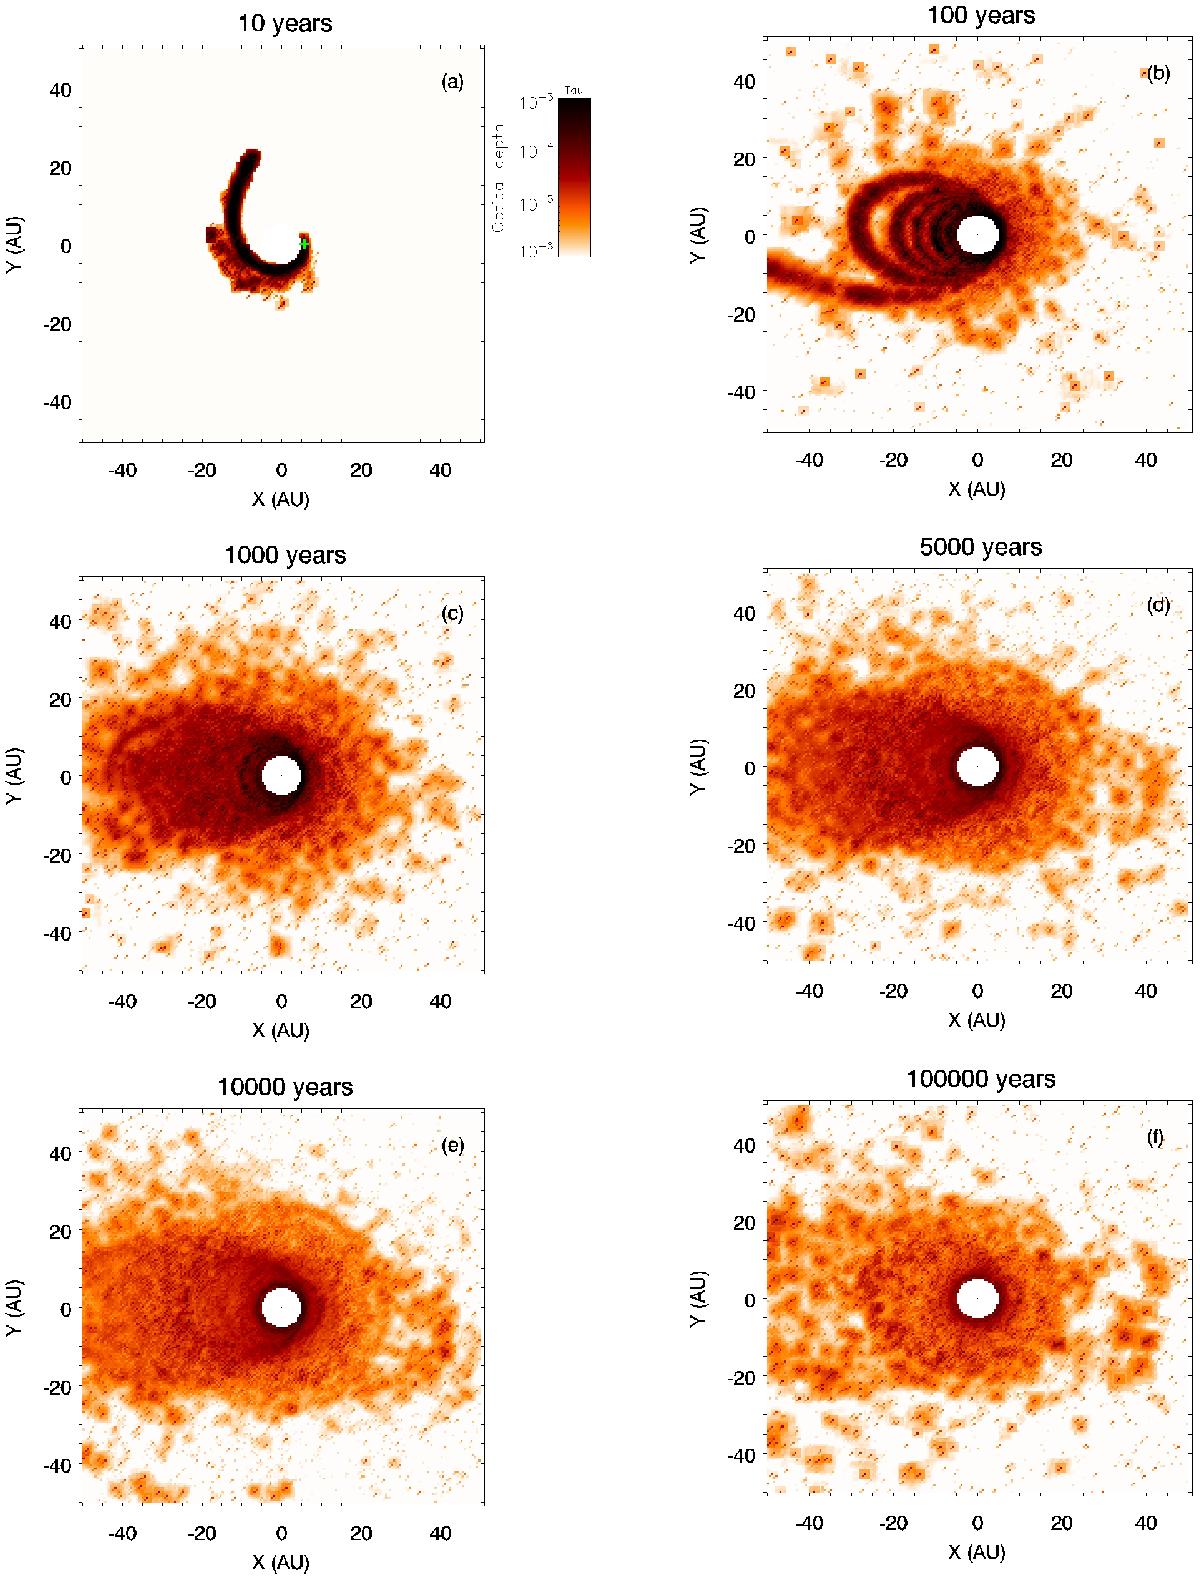
Evolution of the system after the release of 1021 kg of material at 6 AU from the central A7V star. 2D map, in a non-rotating inertial frame, of the optical depth at different epochs after the initial breakup. The green cross on plot a) is the location of the initial breakup. The colour index goes from 10-3 (black) to 10-6 (light orange).
Current usage metrics show cumulative count of Article Views (full-text article views including HTML views, PDF and ePub downloads, according to the available data) and Abstracts Views on Vision4Press platform.
Data correspond to usage on the plateform after 2015. The current usage metrics is available 48-96 hours after online publication and is updated daily on week days.
Initial download of the metrics may take a while.