Fig. 13
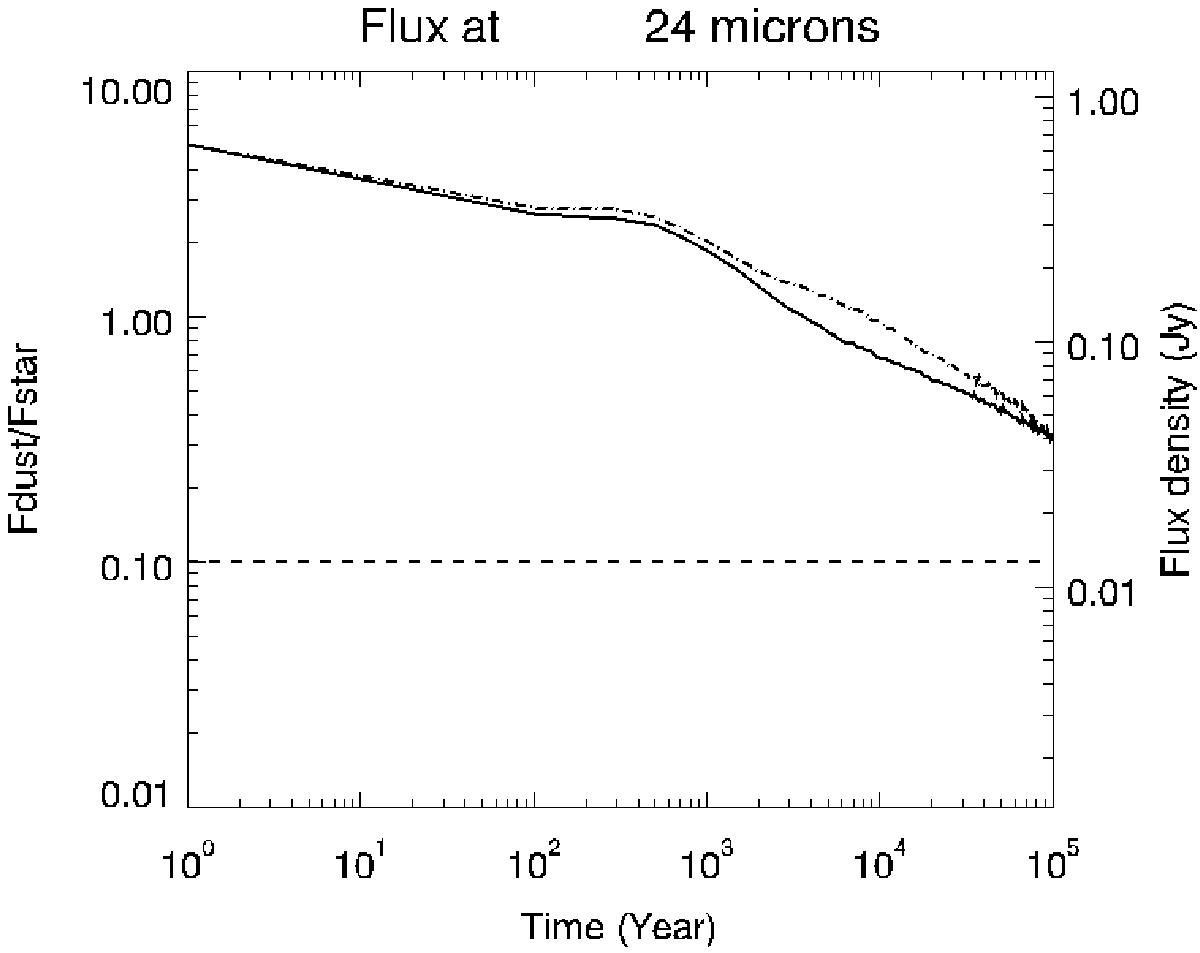
Evolution of the dust’s disc-integrated flux at 24 μm, as computed with GRaTer for two different initial kick velocities: full line is 1 vesc and dash-dotted 2 vesc. The dashed line marks a dust-to-star flux ratio equal to 0.1, taken as our detectability criteria. The X-axis indicates the time after the breakup in years. The right-hand side Y-axis indicates the absolute flux in Jy, while the left-hand side axis displays the ratio of the disc flux to that of the stellar photosphere.
Current usage metrics show cumulative count of Article Views (full-text article views including HTML views, PDF and ePub downloads, according to the available data) and Abstracts Views on Vision4Press platform.
Data correspond to usage on the plateform after 2015. The current usage metrics is available 48-96 hours after online publication and is updated daily on week days.
Initial download of the metrics may take a while.