Fig. 4
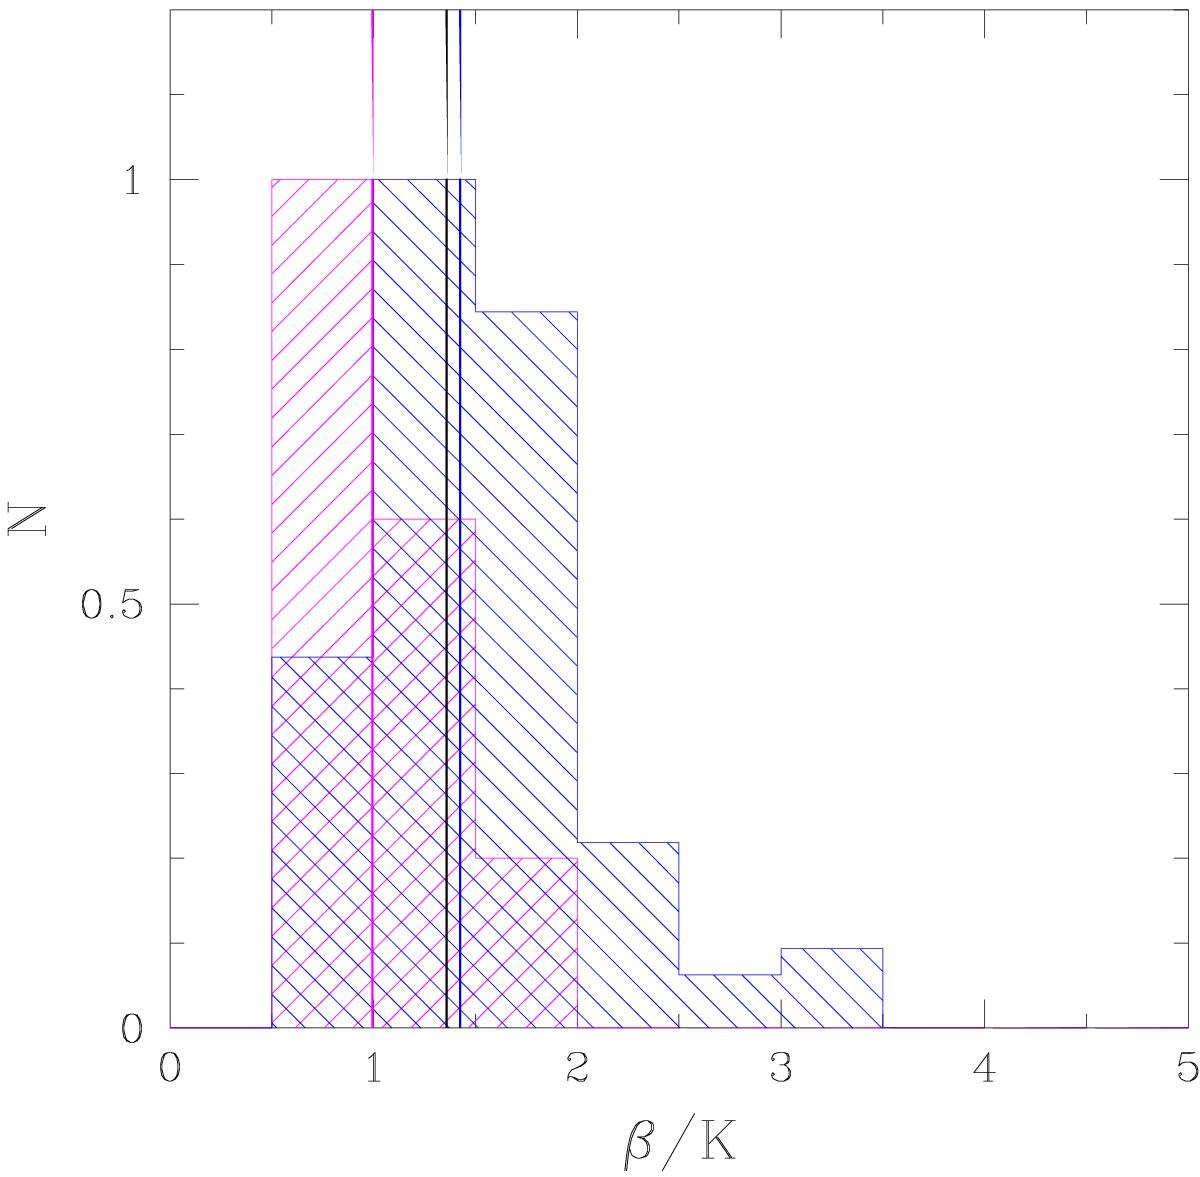
Distribution of the ratio β/K for ATLAS3D ETGs with Σ ≥ 2500M⊙ pc2 (magenta histogram) and for those with Σ < 2500 M⊙ pc2 (blue histogram). Coloured solid lines are the median values of the two relative distributions, while black one refers to the total sample. We have included in the plot only local ETGs with stellar masses in the same range of dense high-z ETGs in our sample (10.7 ≲ LogMvir/M⊙ ≲ 11.5). The β parameter was derived through Eq. (3), while the K coefficient through Eq. (4).
Current usage metrics show cumulative count of Article Views (full-text article views including HTML views, PDF and ePub downloads, according to the available data) and Abstracts Views on Vision4Press platform.
Data correspond to usage on the plateform after 2015. The current usage metrics is available 48-96 hours after online publication and is updated daily on week days.
Initial download of the metrics may take a while.