Fig. 2
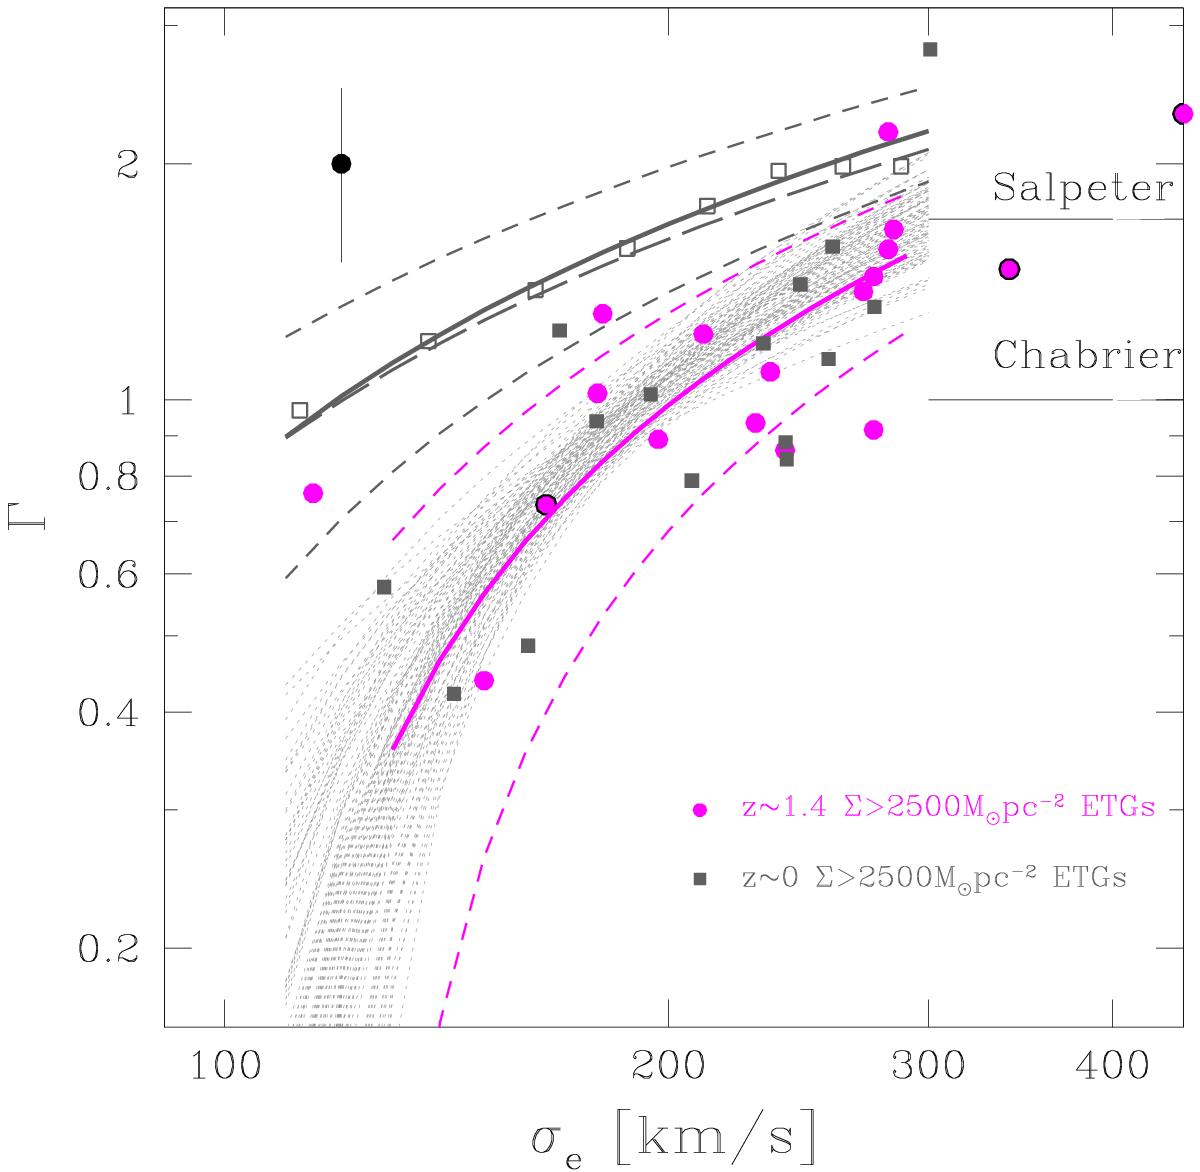
Trend of Γ parameter (see Eq. (1)) as a function of velocity dispersion, for normal (mean stellar mass density Σ < 2500M⊙ pc-2) local ETGs (dark grey solid line) and for the whole local ETG population (long-dashed dark grey line). Dashed grey lines are the scatter around the best-fit relation of normal local ETGs, while grey open squares are the average values of the Γs of local normal ETGs in bin of ~50 km s-1. Magenta points are the upper limits of Γ we have derived for high-z ETGs in our spectroscopic sample at ⟨ z ⟩ = 1.4, and magenta solid line is their best-fit relation (magenta dashed lines indicate the rms around the relation). The black small-dotted lines are the best-fit relations of 100 subsamples of local ETGs, randomly extracted from the local sample by Tortora et al. (2013), in order to have the same Σandσe distribution of our spectroscopic sample at ⟨ z ⟩ = 1.4 (filled dark grey squares are an example of one local subsample). In this procedure we excluded three galaxies of the high-z sample (identified with magenta points with a black contour) since the local sample is missing ETGs with similar Σ and σe. The black point indicates the typical error on Γs of our spectroscopic sample at ⟨ z ⟩ = 1.4.
Current usage metrics show cumulative count of Article Views (full-text article views including HTML views, PDF and ePub downloads, according to the available data) and Abstracts Views on Vision4Press platform.
Data correspond to usage on the plateform after 2015. The current usage metrics is available 48-96 hours after online publication and is updated daily on week days.
Initial download of the metrics may take a while.