Fig. 1
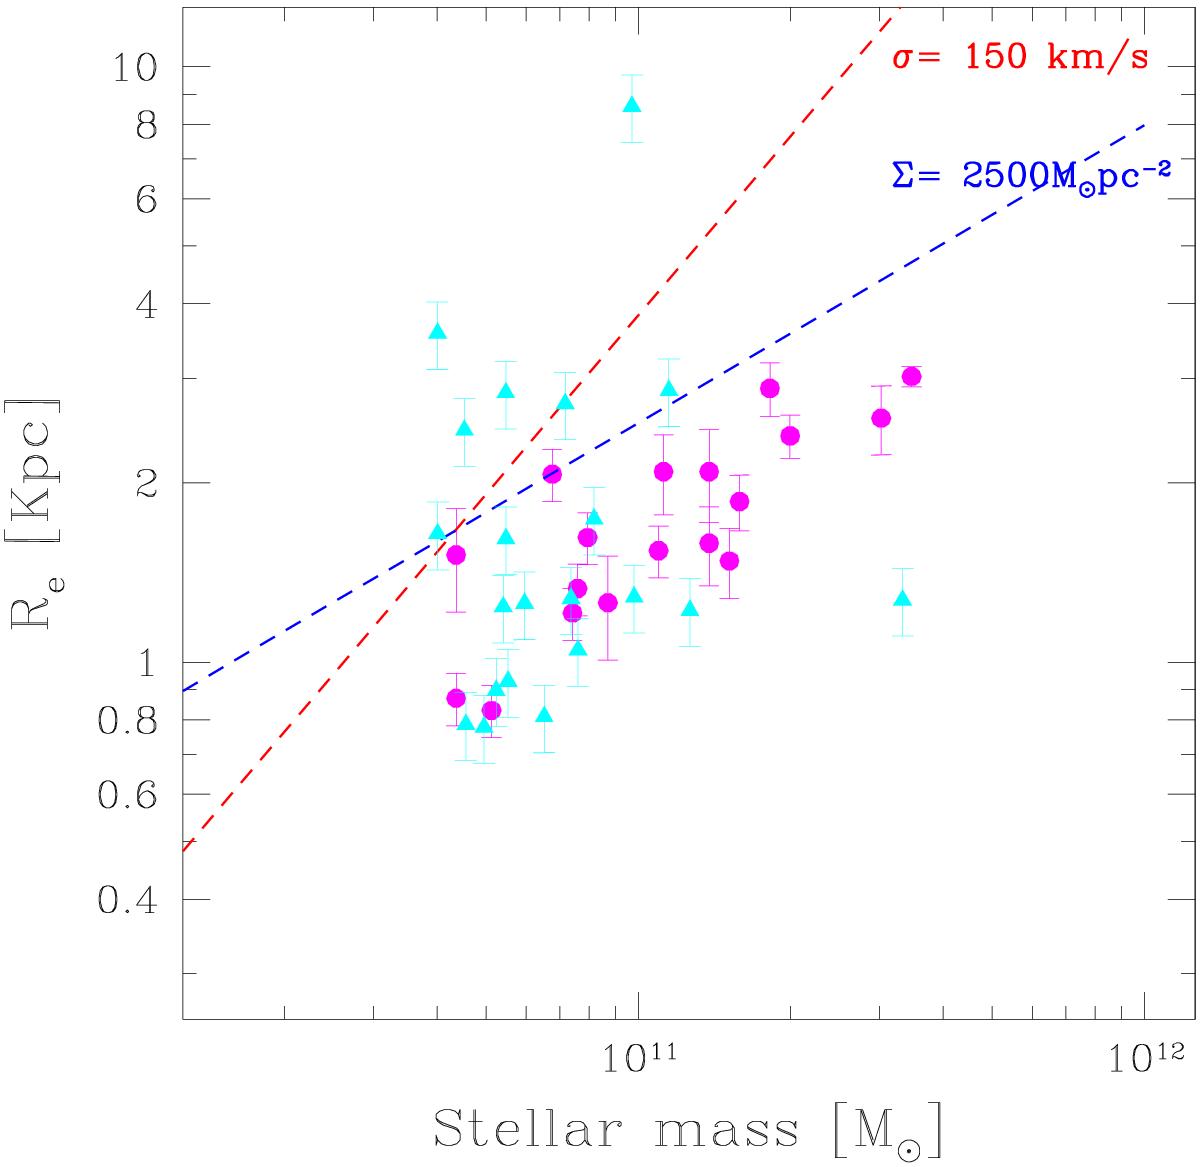
Distribution of the ETGs of the total high-z sample in the Re − M⋆ plane (magenta points). Cyan triangles are a complete sample of ETGs selected from the GOODS-South field in the redshift range 1.2 <z< 1.6 (Tamburri et al. 2014) for reference. Blue(red) lines indicate lines of constant Σ(σ). We note that the sample of ETGs at ⟨ z ⟩ = 1.4 with velocity dispersions available is skewed toward more compact systems.
Current usage metrics show cumulative count of Article Views (full-text article views including HTML views, PDF and ePub downloads, according to the available data) and Abstracts Views on Vision4Press platform.
Data correspond to usage on the plateform after 2015. The current usage metrics is available 48-96 hours after online publication and is updated daily on week days.
Initial download of the metrics may take a while.