Fig. 3
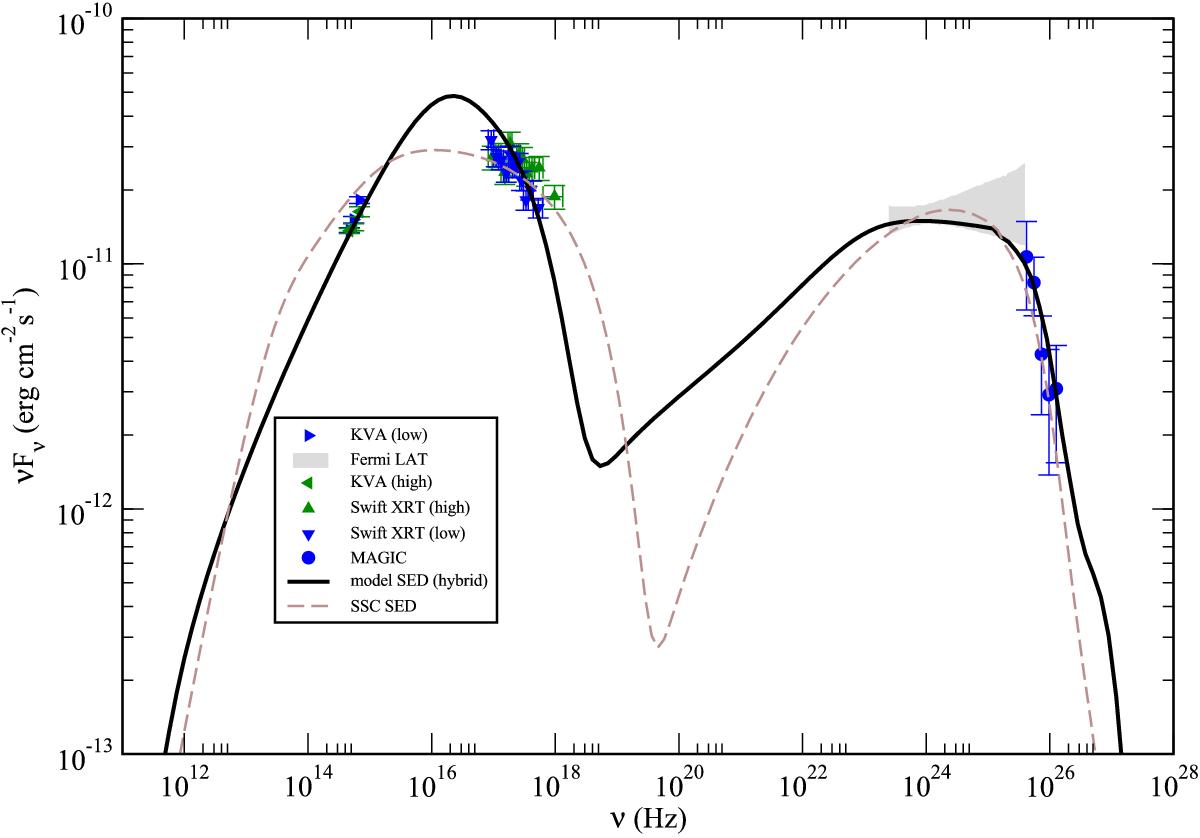
Simultaneous data from Reinthal et al. (2011) with KVA in the optical, Swift XRT in the X-rays, and MAGIC in the VHEs as measured. Blue symbols indicate the low emission state used in the modelling. The high state inferred from the slight variability is shown in green. The grey butterfly represents the first-year catalogue spectrum of Fermi-LAT (The Fermi Collaboration 2010). The grey (online: brown) dashed curve displays the modelling attempt with a low magnetic field and no protons present in the jet (Table 1a); the black solid curve is due to the modelling with high B-field co-accelerated protons (Table 1b). The model SEDs have been EBL-absorbed using the model of Primack et al. (2005).
Current usage metrics show cumulative count of Article Views (full-text article views including HTML views, PDF and ePub downloads, according to the available data) and Abstracts Views on Vision4Press platform.
Data correspond to usage on the plateform after 2015. The current usage metrics is available 48-96 hours after online publication and is updated daily on week days.
Initial download of the metrics may take a while.