Fig. 4
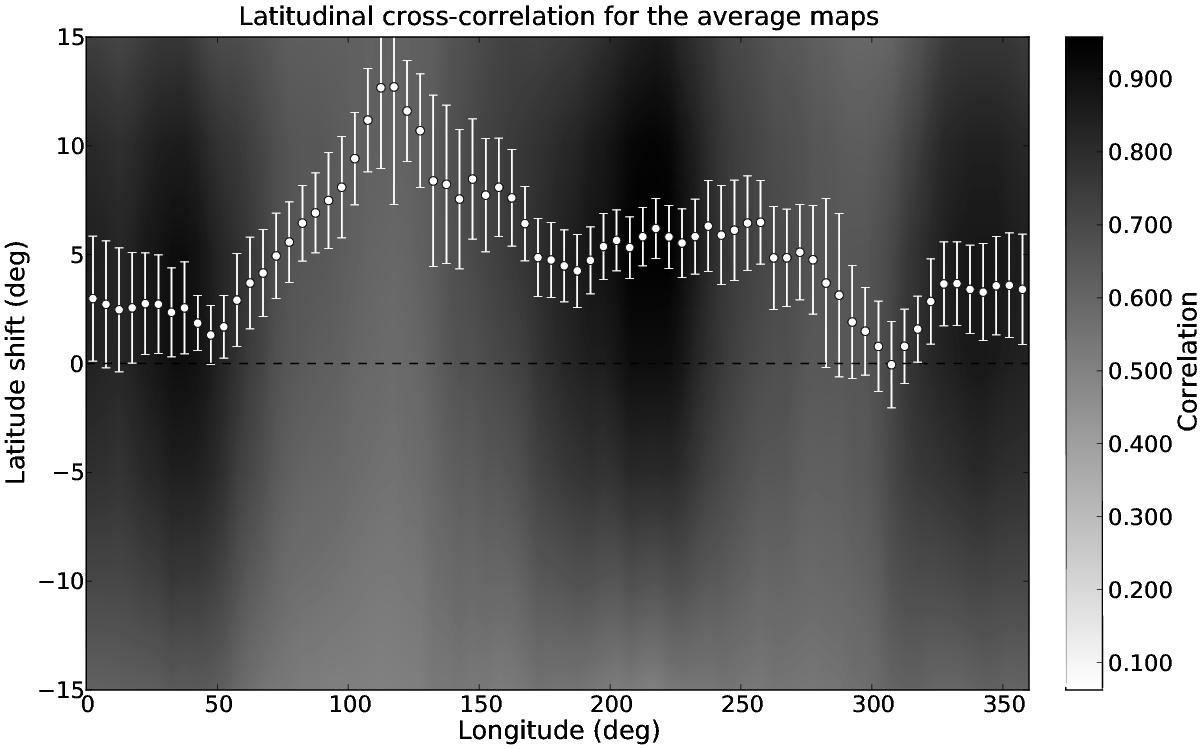
Average latitudinal cross-correlation map from time-series Doppler images. For the combined (Fe+Ca) reconstructions 17 image pairs are averaged. Best correlating latitudinal shifts are marked with dots (Gaussian peaks); the corresponding error bars are proportional to the Gaussian FWHMs. The joint positive shift suggests poleward spot migration at an average velocity of ≈4° per rotation period.
Current usage metrics show cumulative count of Article Views (full-text article views including HTML views, PDF and ePub downloads, according to the available data) and Abstracts Views on Vision4Press platform.
Data correspond to usage on the plateform after 2015. The current usage metrics is available 48-96 hours after online publication and is updated daily on week days.
Initial download of the metrics may take a while.