Fig. 3
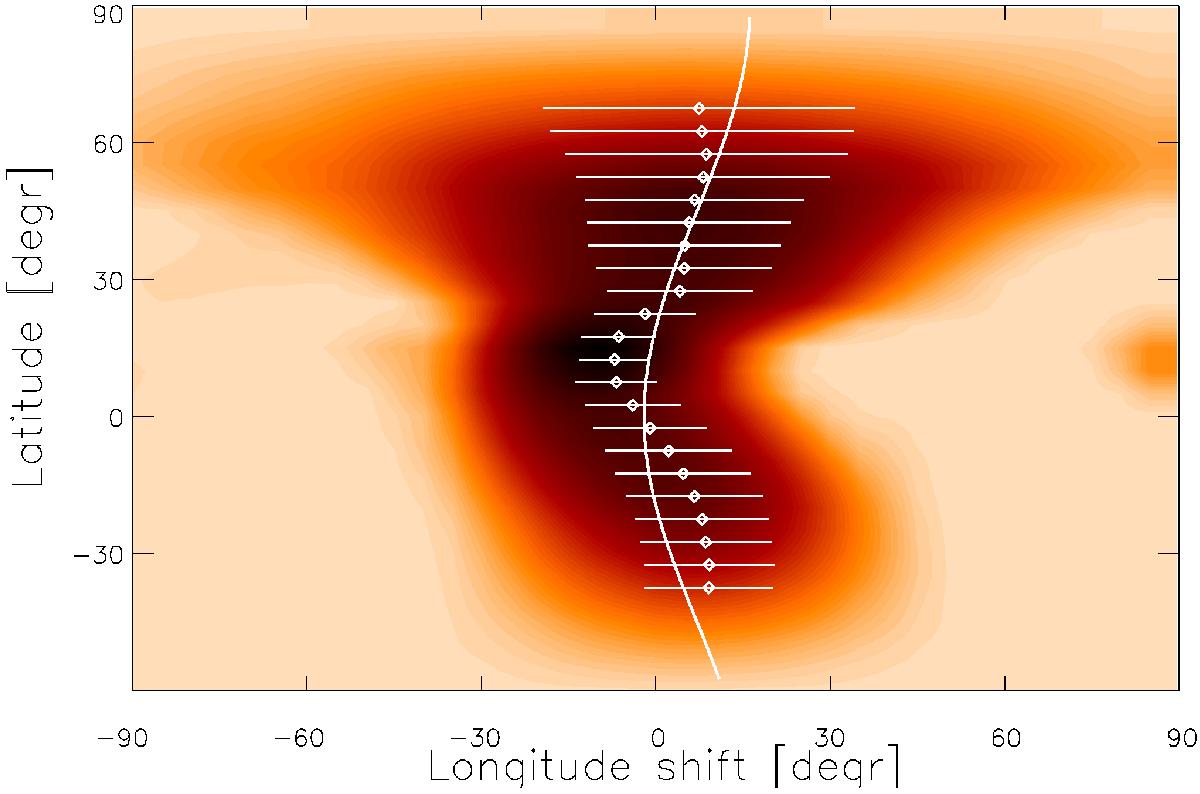
Average cross-correlation function map of σ Gem from the NSO 1996−97 data set. The resulting differential rotation pattern for the combined (Fe+Ca) time-series Doppler images gives evidence of antisolar-type differential rotation. The background shade scales the strength of the correlation (white: no correlation, dark: strong correlation). The dots are the correlation peaks per 5°-latitude bin. Their error bars are defined as the FWHMs of the corresponding Gaussians. Assuming a quadratic DR law, the derived surface shear parameter α is − 0.04 ± 0.01.
Current usage metrics show cumulative count of Article Views (full-text article views including HTML views, PDF and ePub downloads, according to the available data) and Abstracts Views on Vision4Press platform.
Data correspond to usage on the plateform after 2015. The current usage metrics is available 48-96 hours after online publication and is updated daily on week days.
Initial download of the metrics may take a while.