Fig. 2
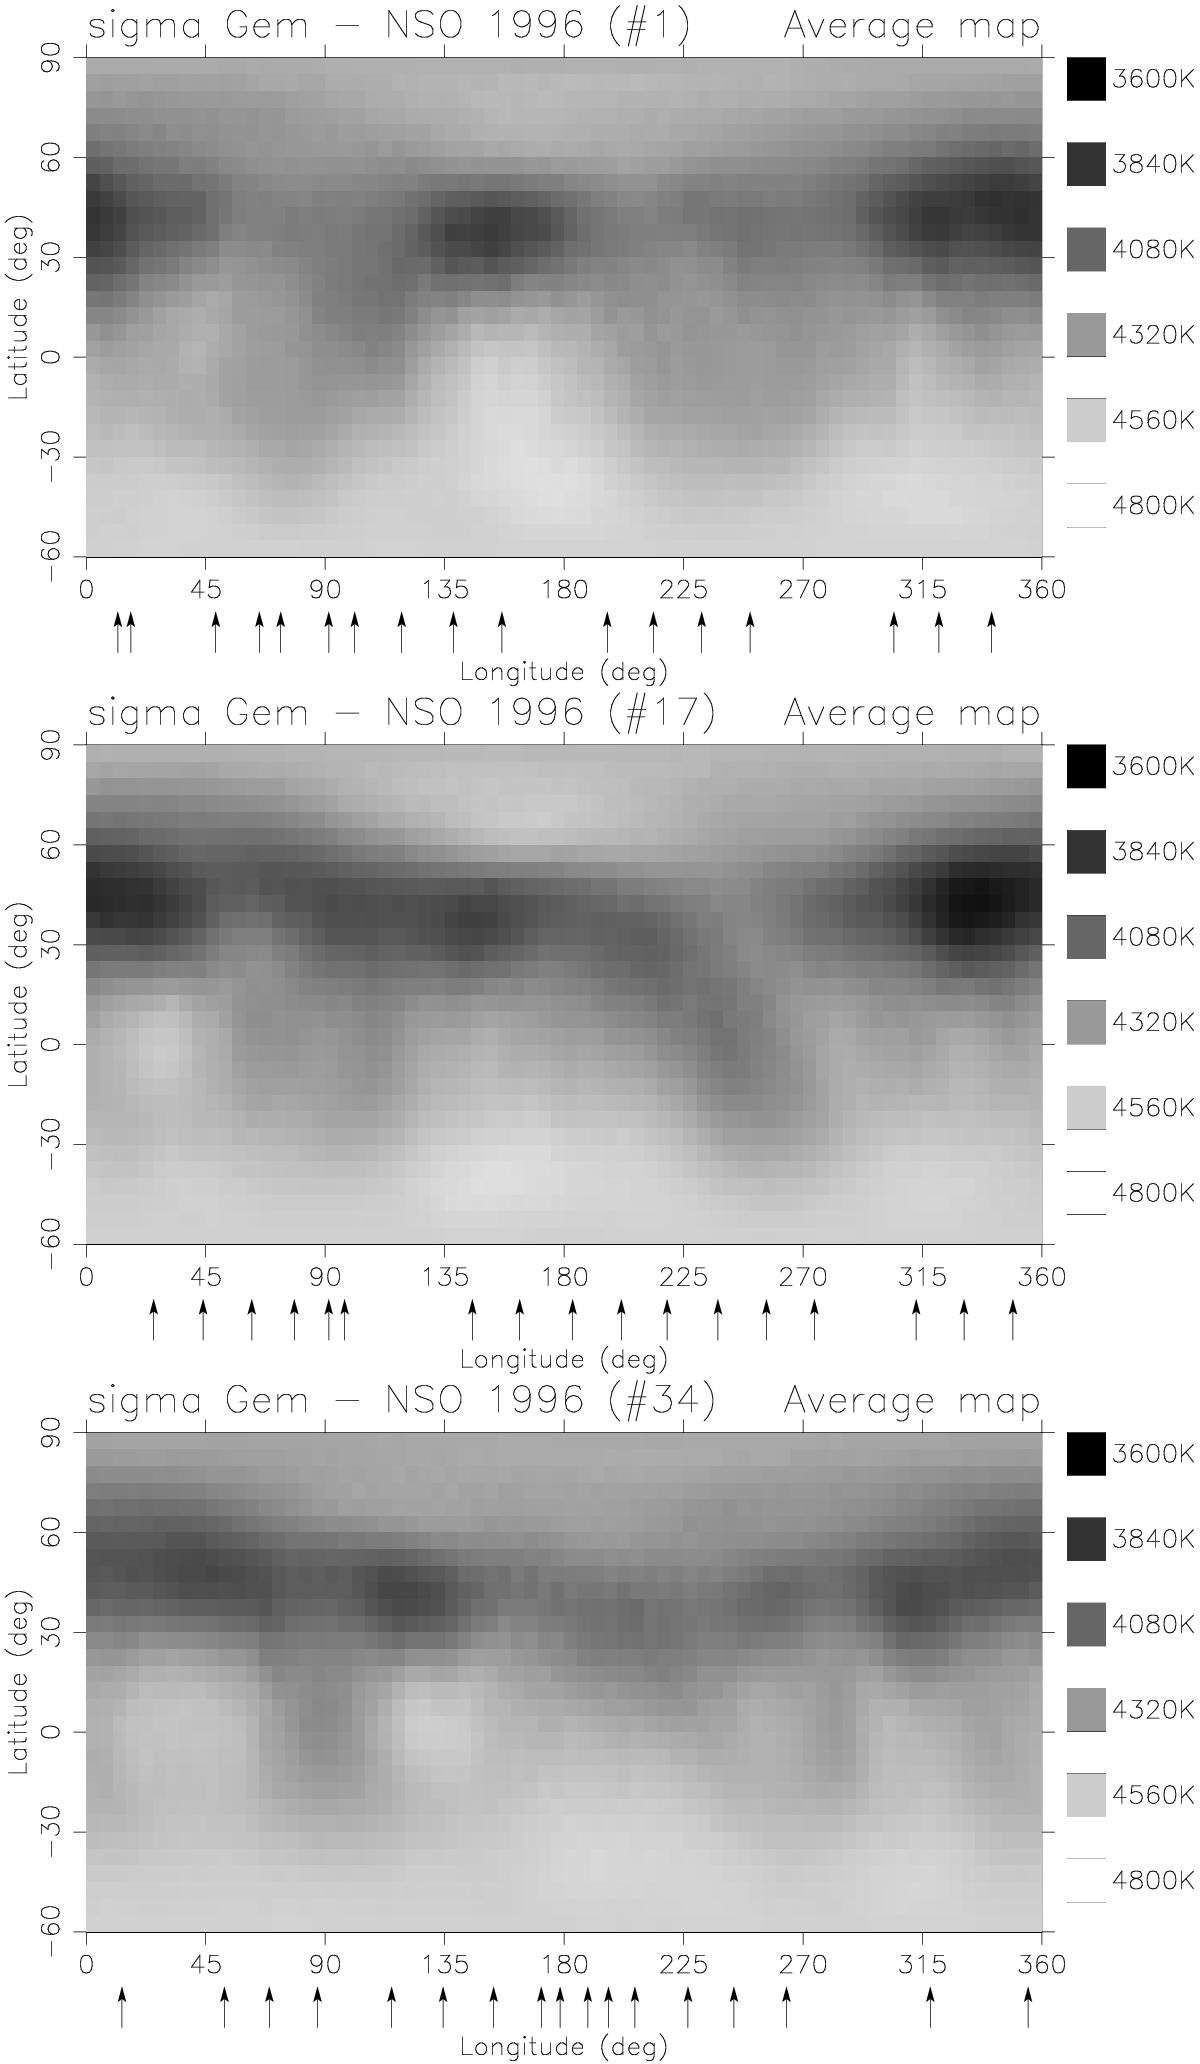
Snapshots from the NSO time-series Doppler images of σ Gem. As examples, the 1st (top), the 17th (middle), and the last (bottom) combined (Fe+Ca) maps are shown. Arrows below the maps mark the phases of the observations. Time lags between the consecutive maps are 23.17 days (from 1st to 17th) and 20.44 days (from 17th to 34th).
Current usage metrics show cumulative count of Article Views (full-text article views including HTML views, PDF and ePub downloads, according to the available data) and Abstracts Views on Vision4Press platform.
Data correspond to usage on the plateform after 2015. The current usage metrics is available 48-96 hours after online publication and is updated daily on week days.
Initial download of the metrics may take a while.