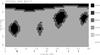
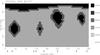
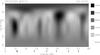
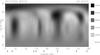
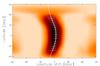
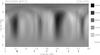
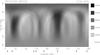
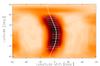
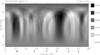
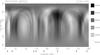
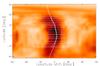
Fig. A.1

Top: two examples from a time series of 28 artificial surface temperature maps as snapshots of a differentially rotating test star applying α = 0.006 surface shear. Below, in the second, third, and forth rows plotted are the corresponding recoveries assuming no data noise, S/N = 200, and S/N = 100, respectively. Phases of the artificial observations are indicated by arrows underneath. In the righthand column, the retrieved DR functions are plotted as best fits (continuous lines) for the correlation patterns of the average cross-correlation function maps. The respective shear parameters are α = 0.0058 ± 0.0002 (no noise, right top), α = 0.0067 ± 0.0006 (S/N = 200, right middle), α = 0.0069 ± 0.0012 (S/N = 100, right bottom).
Current usage metrics show cumulative count of Article Views (full-text article views including HTML views, PDF and ePub downloads, according to the available data) and Abstracts Views on Vision4Press platform.
Data correspond to usage on the plateform after 2015. The current usage metrics is available 48-96 hours after online publication and is updated daily on week days.
Initial download of the metrics may take a while.