Fig. 6
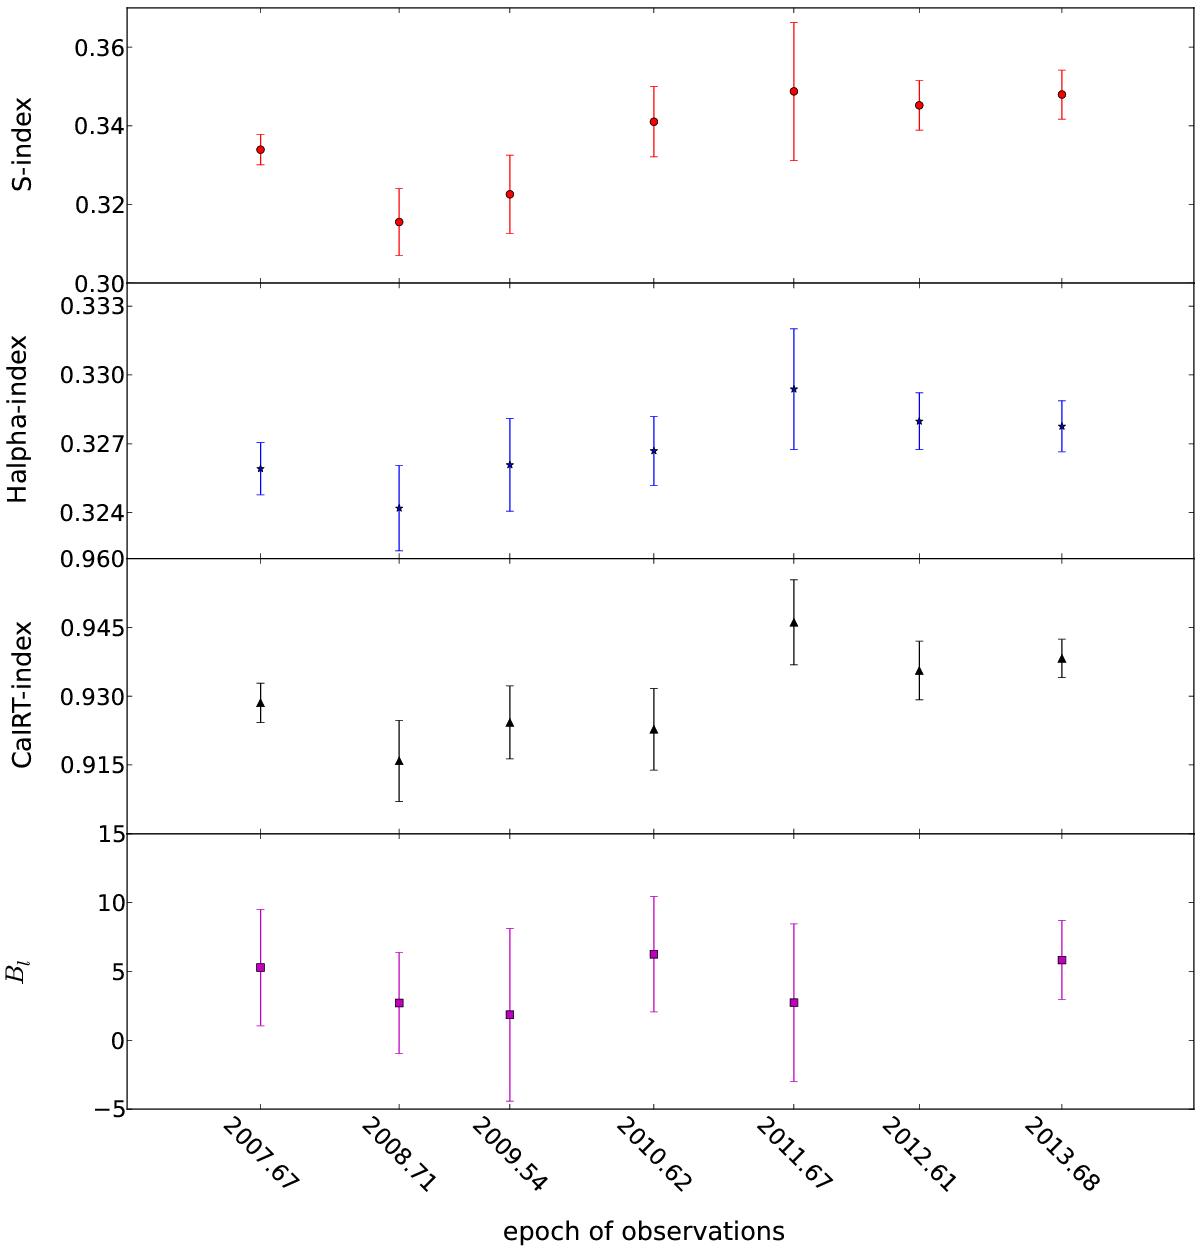
Average value of the three different indices with the vertical bars showing the dispersion in each epoch of observations. Top to bottom: average values of S-index(red full circles), Hα-index (blue stars), CaIRT-index (black triangle) and Bl (magenta squares) plotted against the epochs (2007.67-2013.68) in average Julian dates.
Current usage metrics show cumulative count of Article Views (full-text article views including HTML views, PDF and ePub downloads, according to the available data) and Abstracts Views on Vision4Press platform.
Data correspond to usage on the plateform after 2015. The current usage metrics is available 48-96 hours after online publication and is updated daily on week days.
Initial download of the metrics may take a while.