Free Access
Fig. 3
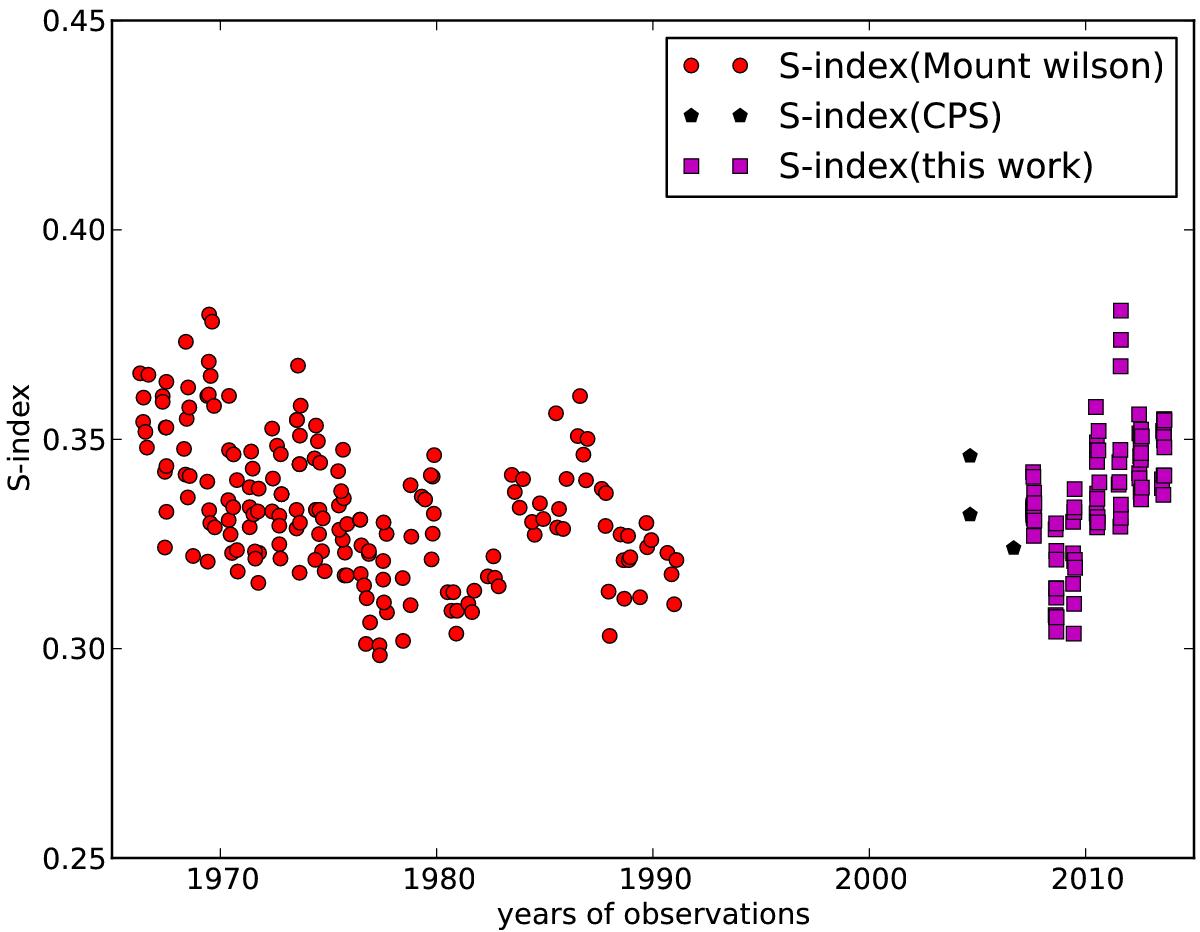
S-index measurements of HN Peg from the combined data sets. The red circles represent data from the Mount Wilson survey, the black hexagons represent data from the CPS survey and the magenta squares are our measurements.
Current usage metrics show cumulative count of Article Views (full-text article views including HTML views, PDF and ePub downloads, according to the available data) and Abstracts Views on Vision4Press platform.
Data correspond to usage on the plateform after 2015. The current usage metrics is available 48-96 hours after online publication and is updated daily on week days.
Initial download of the metrics may take a while.