Fig. 11
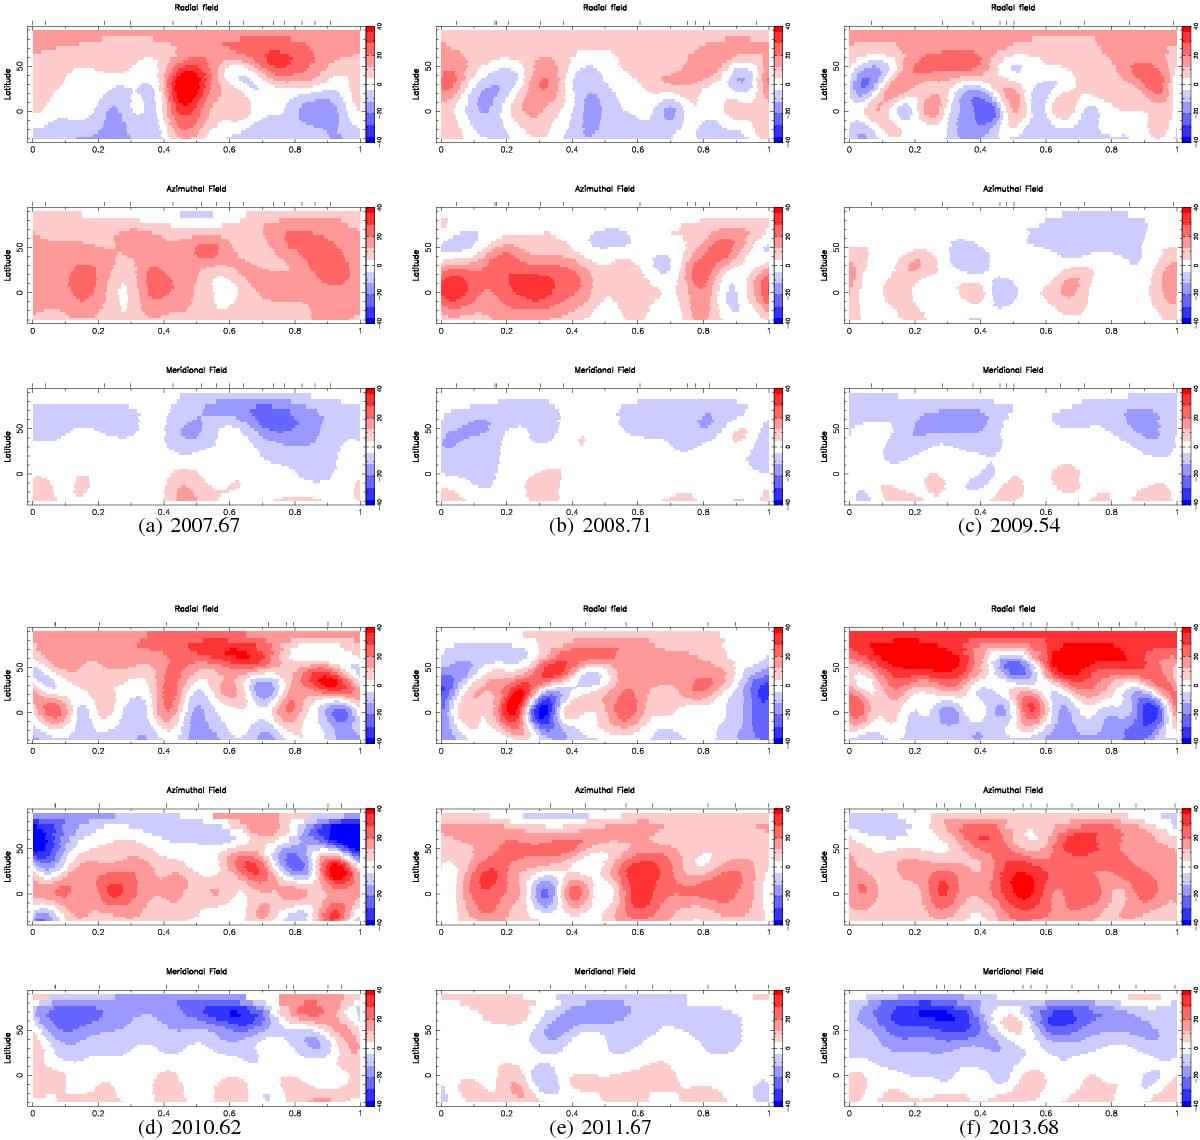
Surface magnetic field geometry of HN Peg for six epochs as reconstructed using Zeeman Doppler Imaging. Top row: a) 2007.67; b) 2008.71; c) 2009.54; bottom row: d) 2010.62; e) 2011.67; f) 2013.68. For each epoch, the magnetic field components are shown as projection onto one axis of the spherical coordinate frame, where from top to bottom: radial, azimuthal and meridional magnetic field components are shown. the field strength is shown in Gauss, where red represents positive polarity and blue represents negative polarity.
Current usage metrics show cumulative count of Article Views (full-text article views including HTML views, PDF and ePub downloads, according to the available data) and Abstracts Views on Vision4Press platform.
Data correspond to usage on the plateform after 2015. The current usage metrics is available 48-96 hours after online publication and is updated daily on week days.
Initial download of the metrics may take a while.