Fig. 10
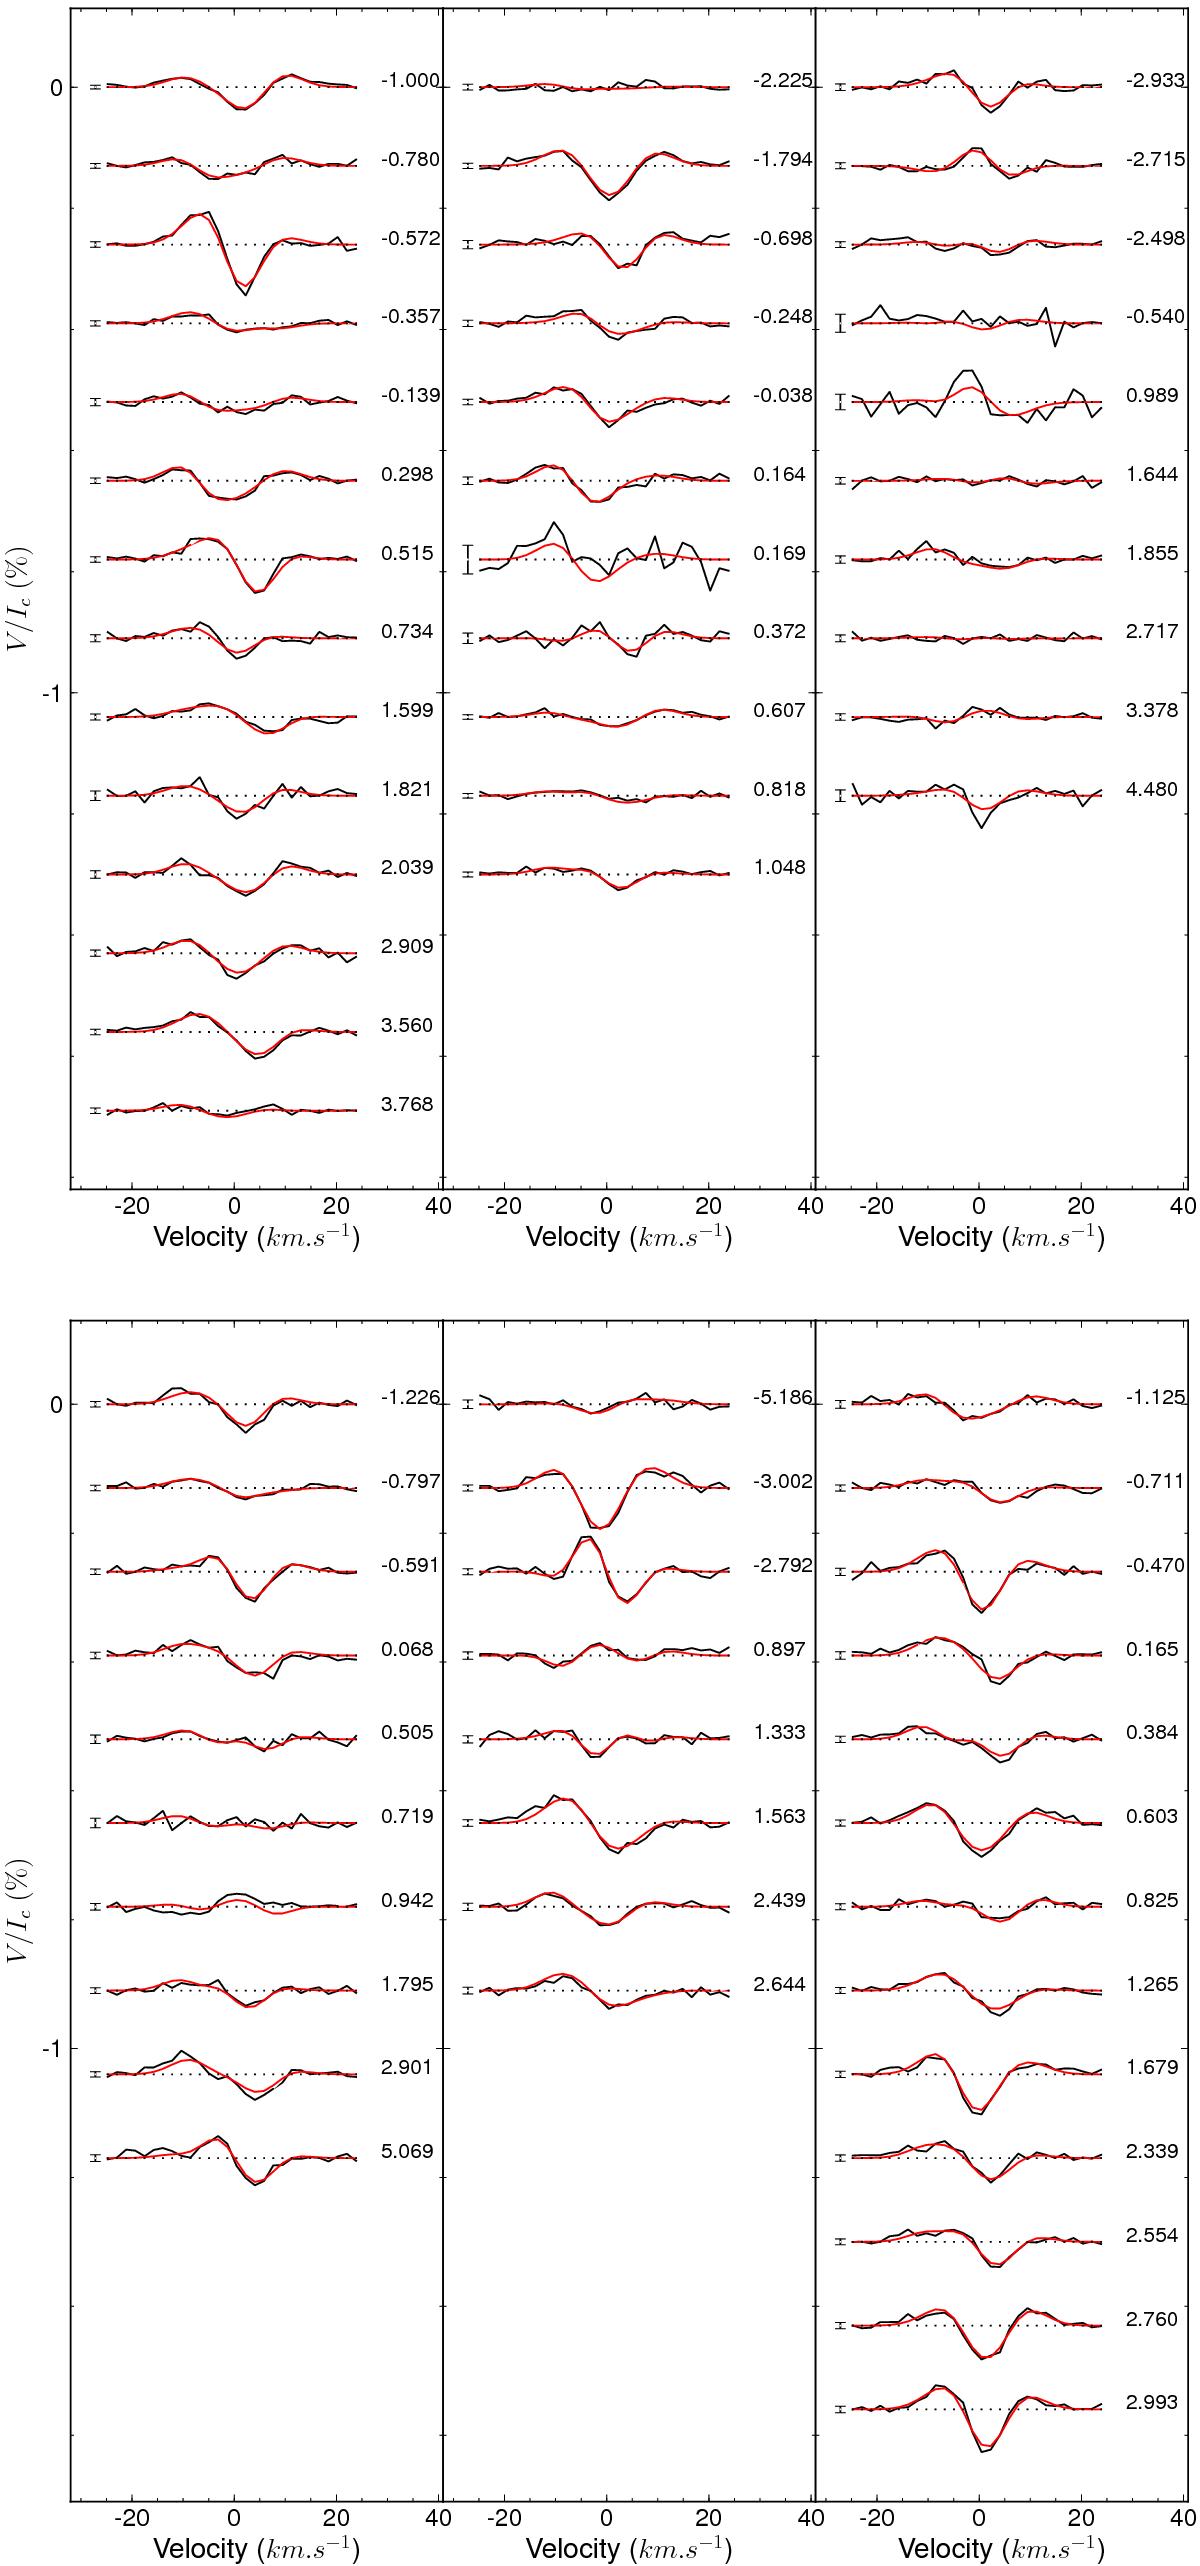
Top row: time series of the LSD Stokes V profiles from 2007.67 (top left), 2008.71 (top centre) and 2009.54 (top right). Bottom row: time series of the LSD Stokes V profiles for the epochs 2010.62 (bottom left), 2011.67 (bottom centre) and 2013.68 (bottom right). The black line represents the observed Stokes V spectra and the red line represents the fit to the spectra. Rotational cycle is shown to the right and 1σ error bars for each observations is shown to the left for each plot.
Current usage metrics show cumulative count of Article Views (full-text article views including HTML views, PDF and ePub downloads, according to the available data) and Abstracts Views on Vision4Press platform.
Data correspond to usage on the plateform after 2015. The current usage metrics is available 48-96 hours after online publication and is updated daily on week days.
Initial download of the metrics may take a while.