Fig. 7
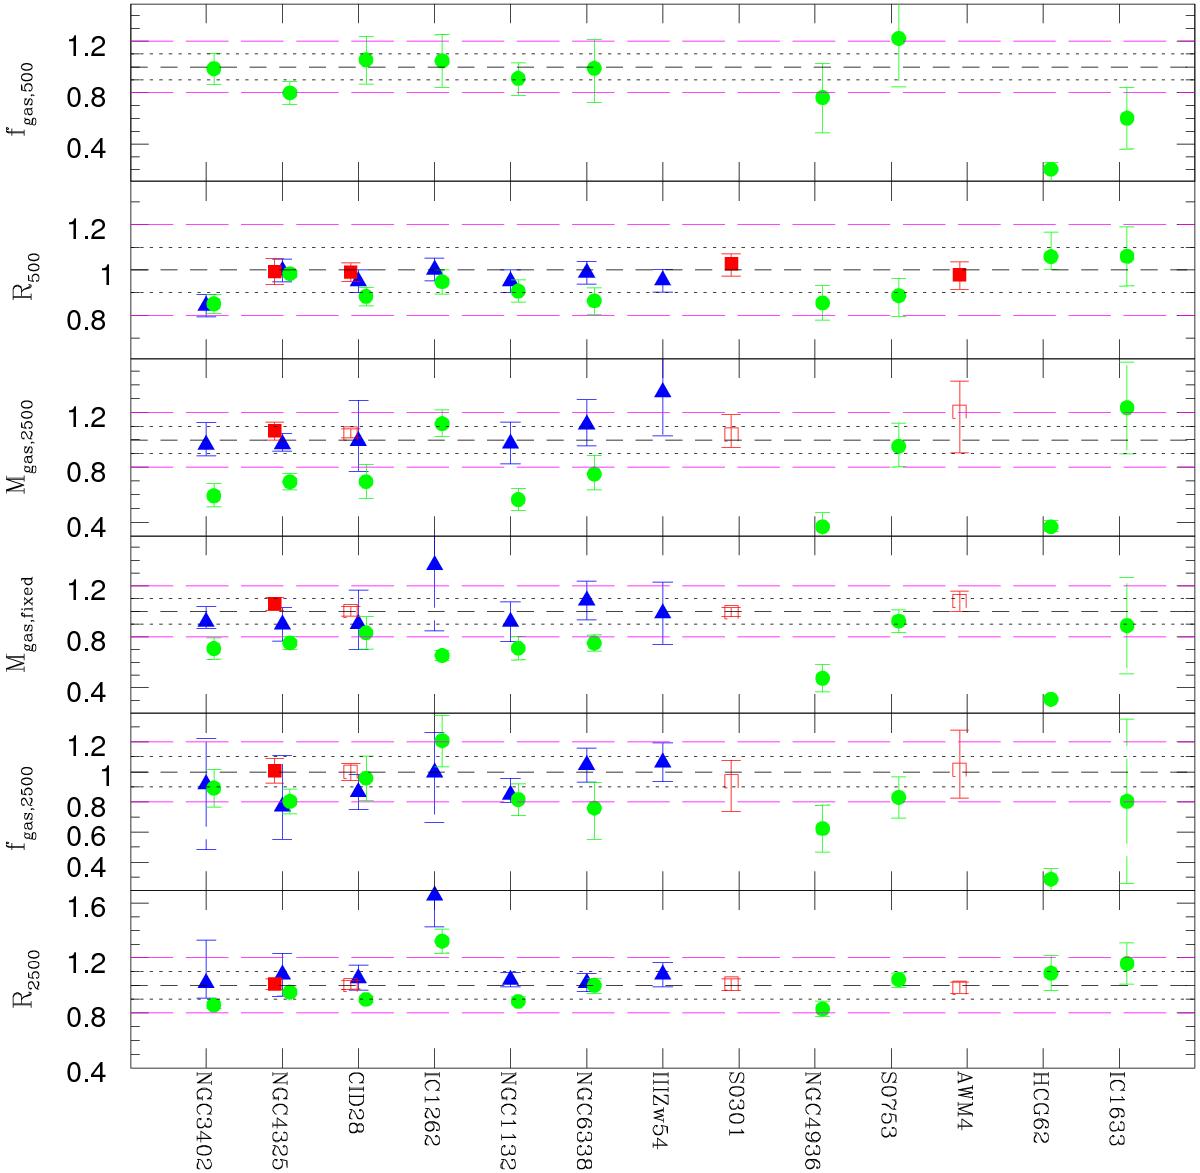
Comparison between the ratio of the results obtained in this work with the results reported by Gastaldello et al. (2007; R2500: filled red squares; R1250: empty red squares), Sun et al. (2009; blue triangles), and Eckmiller et al. (2011; green circles). From bottom to top we compare the ratio of R2500; fgas,2500; Mgas at the fixed R2500 by Gastaldello et al. (2007), Sun et al. (2009), and Eckmiller et al. (2011) with this work; fgas,2500; R500; and fgas,500, respectively.
Current usage metrics show cumulative count of Article Views (full-text article views including HTML views, PDF and ePub downloads, according to the available data) and Abstracts Views on Vision4Press platform.
Data correspond to usage on the plateform after 2015. The current usage metrics is available 48-96 hours after online publication and is updated daily on week days.
Initial download of the metrics may take a while.