Fig. 6
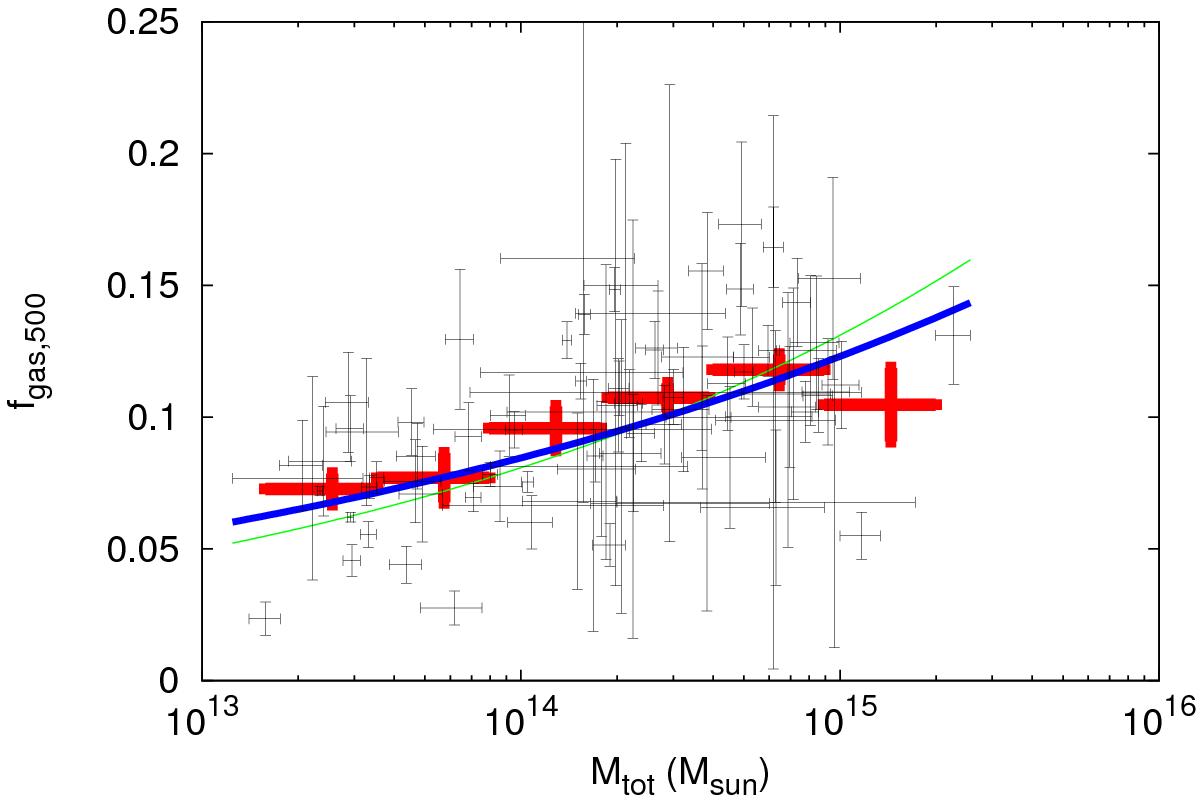
Gas fraction as a function of the total mass. The black points represent the single objects (groups and HIFLUGCS), the red points are the mean values. The error bars are the standard errors. The solid blue line represents the best fit to the unbinned data. The parameters are listed in Table 4. The green line represents the best fit obtained by Pratt et al. (2009).
Current usage metrics show cumulative count of Article Views (full-text article views including HTML views, PDF and ePub downloads, according to the available data) and Abstracts Views on Vision4Press platform.
Data correspond to usage on the plateform after 2015. The current usage metrics is available 48-96 hours after online publication and is updated daily on week days.
Initial download of the metrics may take a while.