Fig. 2
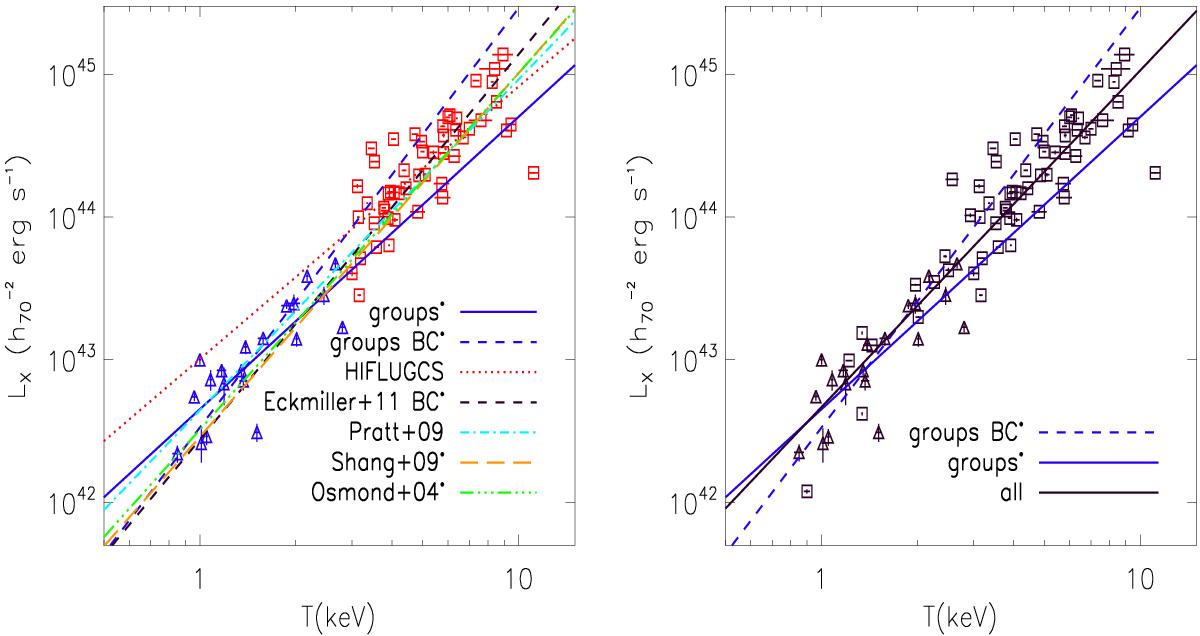
Left: LX − T relation. Blue triangles are groups, red boxes are HIFLUGCS clusters with a temperature higher than 3 keV. The stars indicate the works that studied galaxy groups. Right: same points as in the left panel plus the HIFLUGCS clusters with a temperature lower than 3 keV. BC indicates the relation corrected for the selection bias effects.
Current usage metrics show cumulative count of Article Views (full-text article views including HTML views, PDF and ePub downloads, according to the available data) and Abstracts Views on Vision4Press platform.
Data correspond to usage on the plateform after 2015. The current usage metrics is available 48-96 hours after online publication and is updated daily on week days.
Initial download of the metrics may take a while.