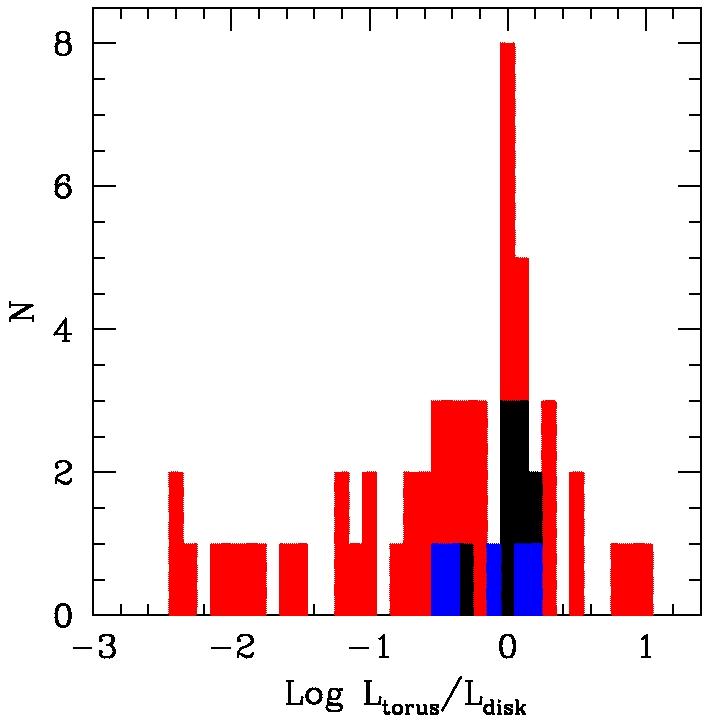
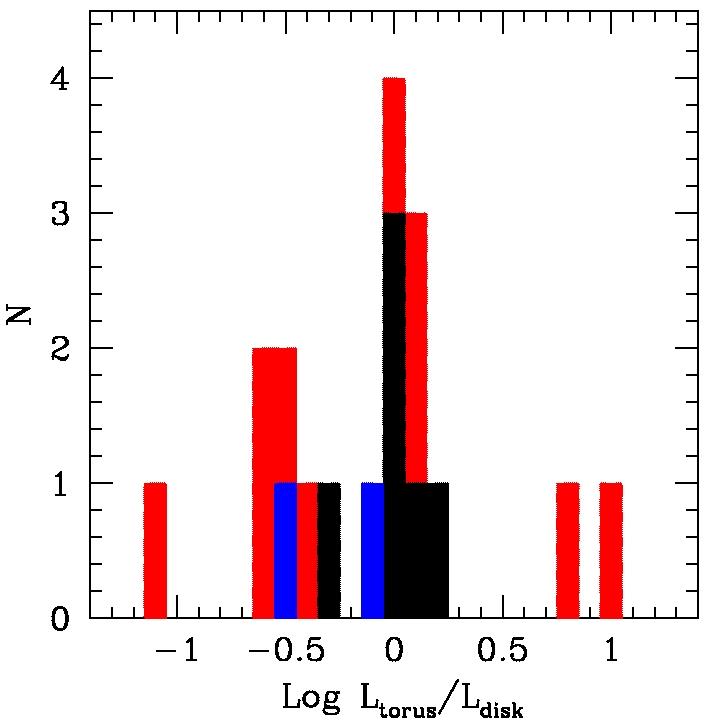
Fig. 5
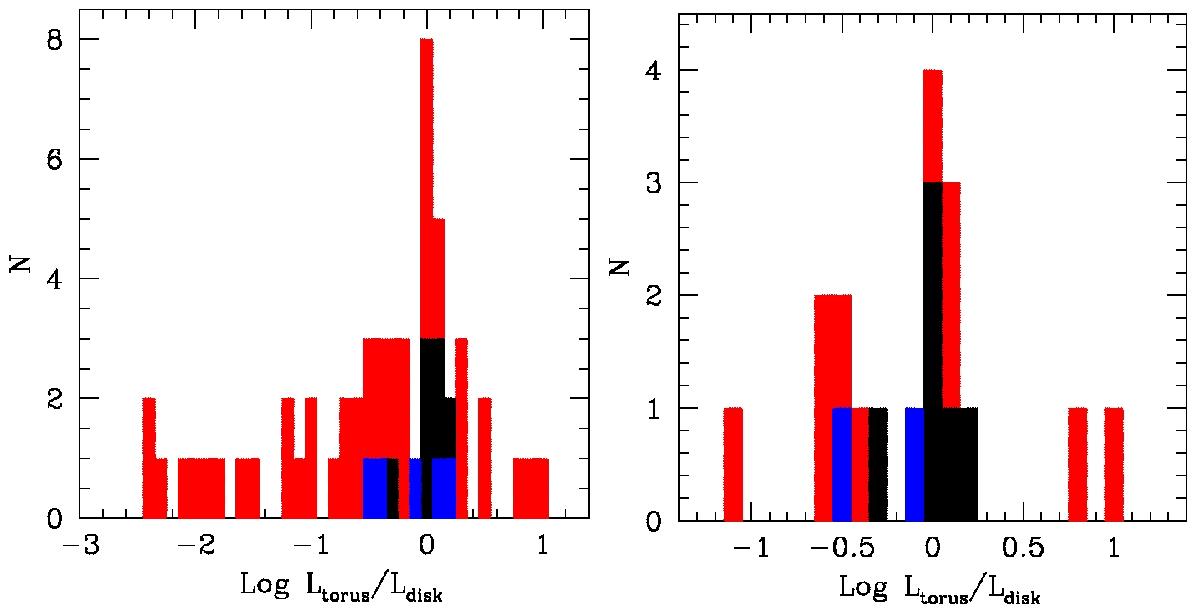
Left panel: distribution of the ratio of the torus to the disk luminosities for the 55 FSRQs with both disk and torus luminosity estimates (or upper limits). Right panel: distribution for the subsample of 18 sources located at z ≤ 1. In both panels, the black histogram shows the sources with evidence of torus, the red histogram those with only upper limits to the torus luminosity. For the latter the luminosity ratios are upper limits. The blue bars correspond to WMAP7 no. 042, 166, 191, 250, and 428 for which the evidence for the torus is tentative; among them only WMAP7 no. 250 and 428 are at z ≤ 1 and therefore also appear in the right panel.
Current usage metrics show cumulative count of Article Views (full-text article views including HTML views, PDF and ePub downloads, according to the available data) and Abstracts Views on Vision4Press platform.
Data correspond to usage on the plateform after 2015. The current usage metrics is available 48-96 hours after online publication and is updated daily on week days.
Initial download of the metrics may take a while.