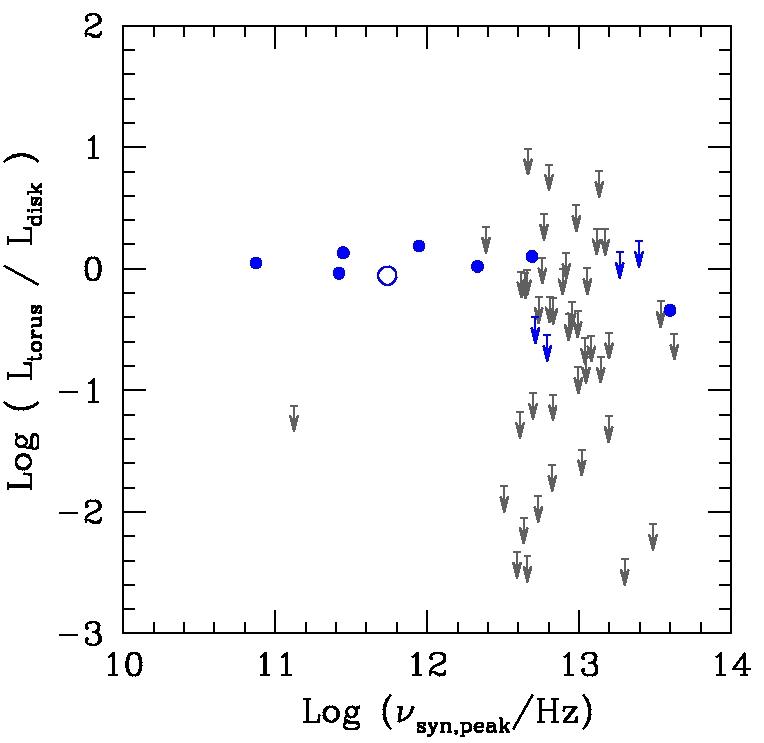
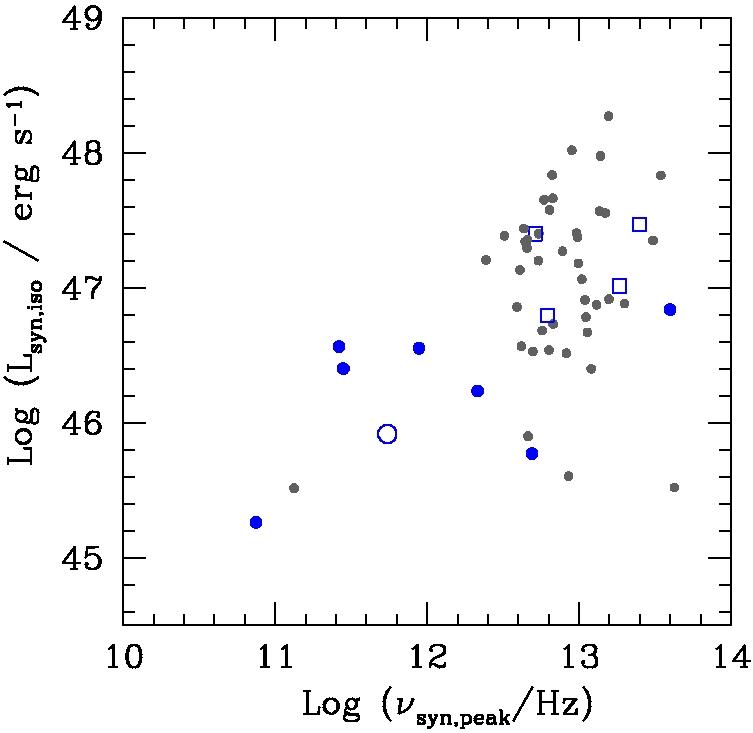
Fig. 4
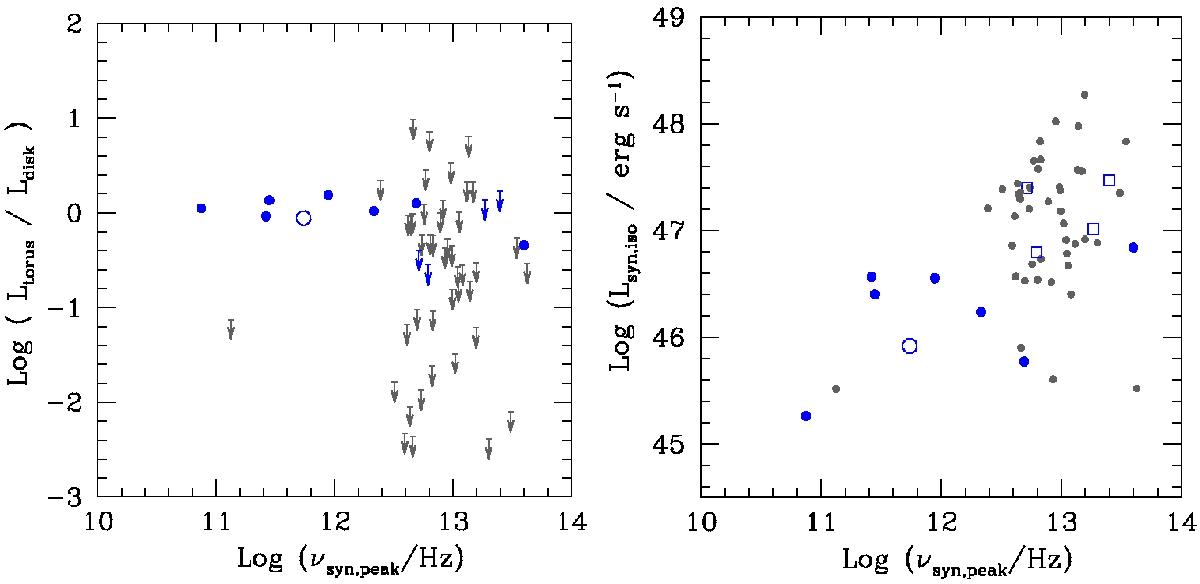
Torus to disk luminosity versus synchrotron peak frequency (left panel) and synchrotron luminosity versus synchrotron peak frequency (right panel) for the 55 FSRQs with evidence of blue bump. The filled blue points are the FSRQs with evidence of torus; the open blue circle is WMAP7 no. 250, for which the presence of torus is less certain. Blue upper limits (left panel) and open blue squares (right panel) correspond to sources WMAP7 no. 042, 166, 191, and 428 which show tentative evidence of torus. Gray symbols refer to the remaining FSRQs without evidence of torus.
Current usage metrics show cumulative count of Article Views (full-text article views including HTML views, PDF and ePub downloads, according to the available data) and Abstracts Views on Vision4Press platform.
Data correspond to usage on the plateform after 2015. The current usage metrics is available 48-96 hours after online publication and is updated daily on week days.
Initial download of the metrics may take a while.