Fig. 6
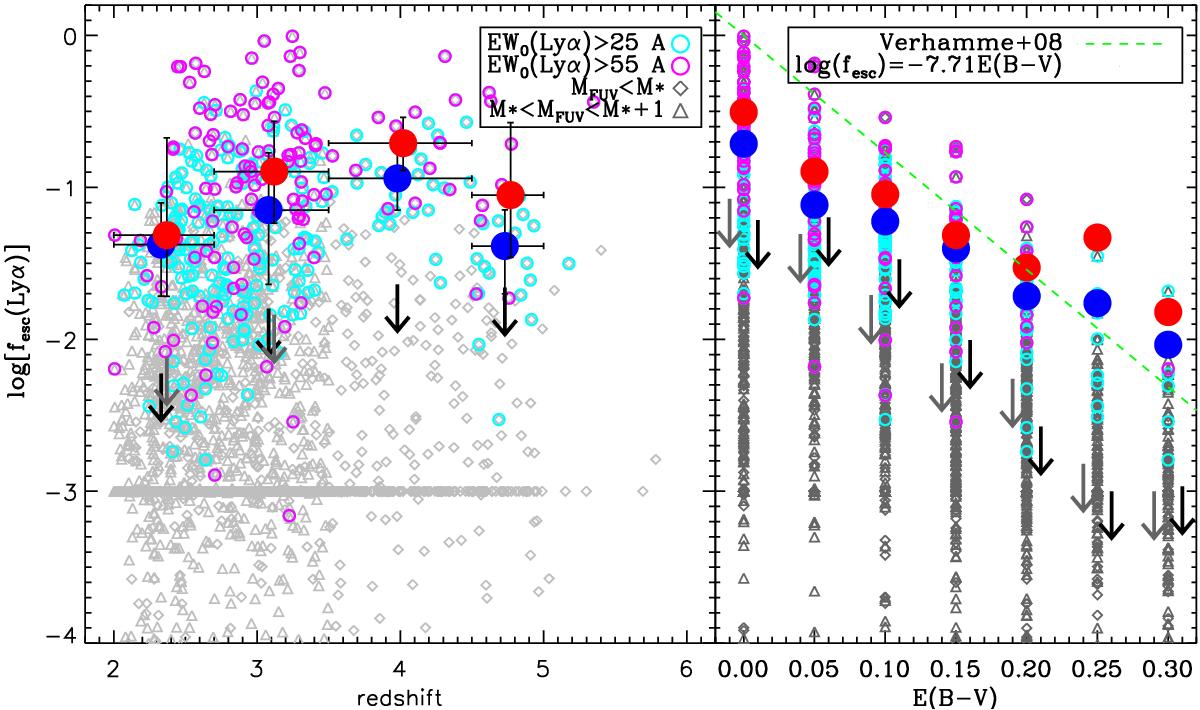
Left panel: Lyα escape fraction as a function of redshift for the bright (gray diamonds) and faint (gray triangles) volume limited samples. Strong Lyα emitters with EW0> 25 Å and EW0> 55 Å are shown with cyan and magenta empty circles, respectively. Objects with formally negative equivalent width of Lyα, corresponding to negative Lyα luminosity, are set here to log [ fesc(Lyα) ] = − 3. The big red and blue circles indicate the median escape fraction for the galaxies with EW0 [ Lyα ] > 55 Å and EW0 [ Lyα ] > 25 Å, respectively. The black (gray) arrows indicate the fesc(Lyα) below which 80% of the bright (faint) objects lie. Right panel: Lyα escape fraction as a function of the E(B − V). The symbols are the same than in the left panel. The green dashed line shows the prediction by Verhamme et al. (2006).
Current usage metrics show cumulative count of Article Views (full-text article views including HTML views, PDF and ePub downloads, according to the available data) and Abstracts Views on Vision4Press platform.
Data correspond to usage on the plateform after 2015. The current usage metrics is available 48-96 hours after online publication and is updated daily on week days.
Initial download of the metrics may take a while.