Fig. 5
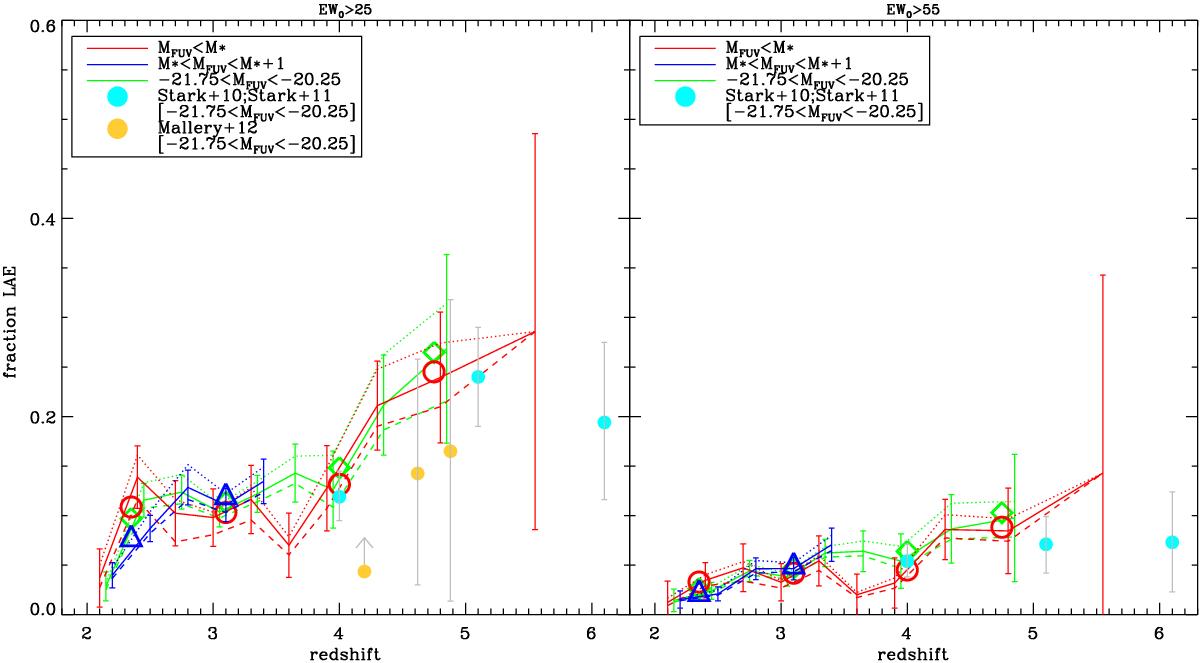
Same as Fig. 4, but with a finer binning in redshift, and showing the effect of including galaxies with flags 0 and 1. The left panel shows the case when the galaxies with EW0(Lyα) > 25 Å are considered as emitters, and the right panel when the threshold is fixed at EW0(Lyα) > 55 Å. The fiducial values, shown by the continuous thick lines, include all the galaxies with spectroscopic flag 2, 3, 4 and 9, and also all the galaxies with a spectroscopic flag 1 and a spectroscopic redshift that differs less than 10% from the photometric one. The dotted line shows the case when only flags 2, 3, 4, and 9 are considered; the dashed line is the same as the fiducial case, but the galaxies with no spectroscopic redshift (flag = 0) are also included, with the redshift fixed to the photometric one. The red curves are for the bright volume limited sample; the blue ones are for the faint one; the green ones are for galaxies with − 21.75 <mFUV< − 20.25. For clarity, the error bars are shown only for the continuous curves. The cyan points are from Stark et al. (2010, 2011), the yellow ones from Mallery et al. (2012). The red circles, blue triangles and green lozenges show the coarser binning in redshift adopted in Fig. 4.
Current usage metrics show cumulative count of Article Views (full-text article views including HTML views, PDF and ePub downloads, according to the available data) and Abstracts Views on Vision4Press platform.
Data correspond to usage on the plateform after 2015. The current usage metrics is available 48-96 hours after online publication and is updated daily on week days.
Initial download of the metrics may take a while.