Fig. 3
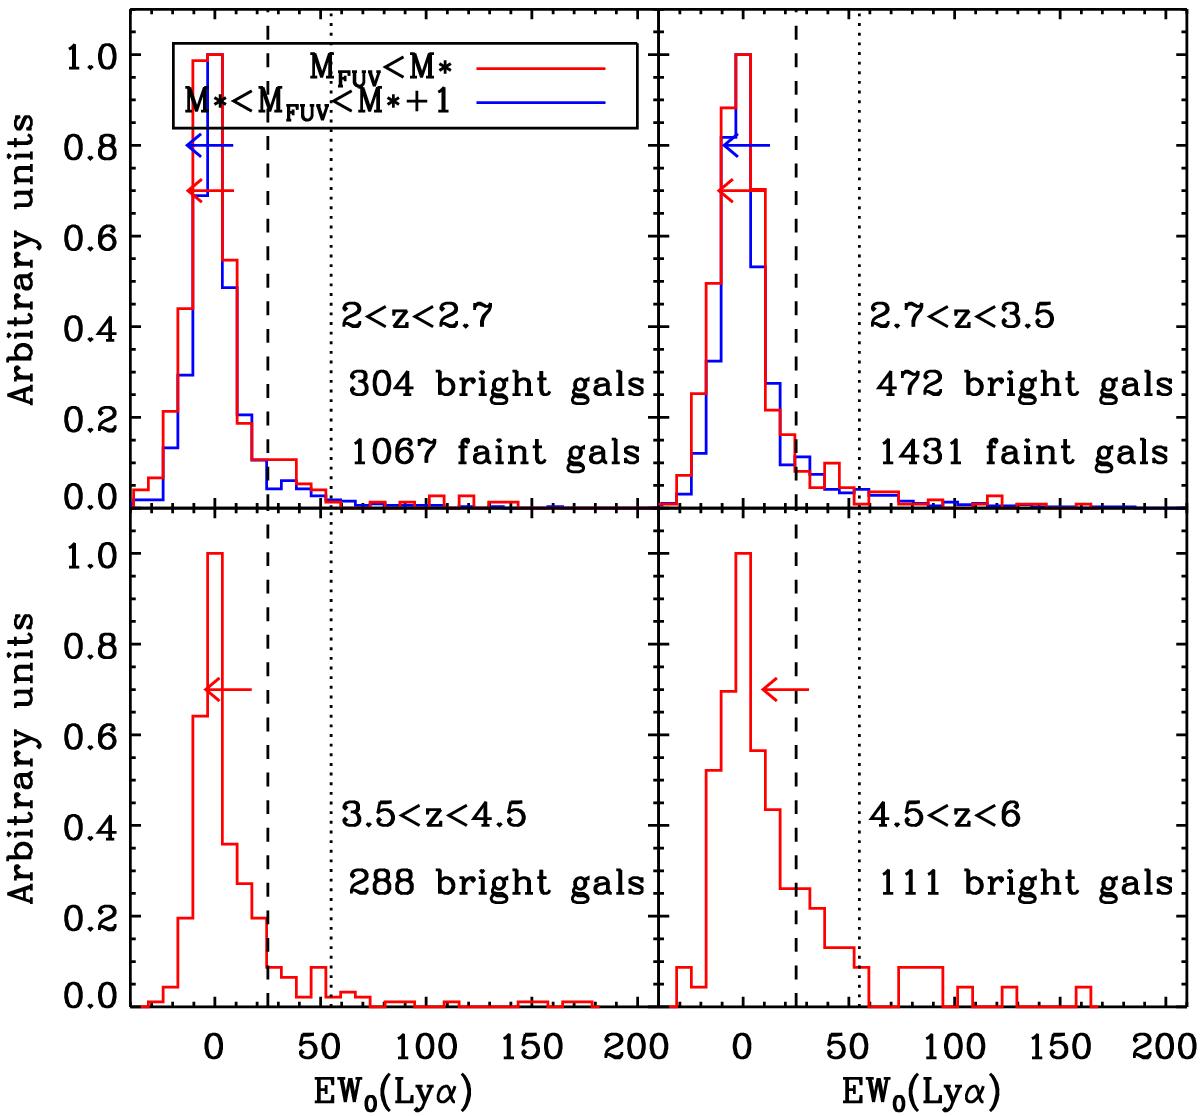
Rest-frame equivalent width EW0 of the Lyα line in four redshift bins. The dashed and dotted lines, respectively at EW0 = 25 and 55 Å, represent the two thresholds that we apply in the analysis. The red and blue histogram indicate the bright sample (MFUV<M∗) and the faint (M∗<MFUV<M∗ + 1) one, respectively. 80% of the galaxies in each panel have an EW0(Lyα) below the value indicated by the arrow.
Current usage metrics show cumulative count of Article Views (full-text article views including HTML views, PDF and ePub downloads, according to the available data) and Abstracts Views on Vision4Press platform.
Data correspond to usage on the plateform after 2015. The current usage metrics is available 48-96 hours after online publication and is updated daily on week days.
Initial download of the metrics may take a while.