Fig. 2
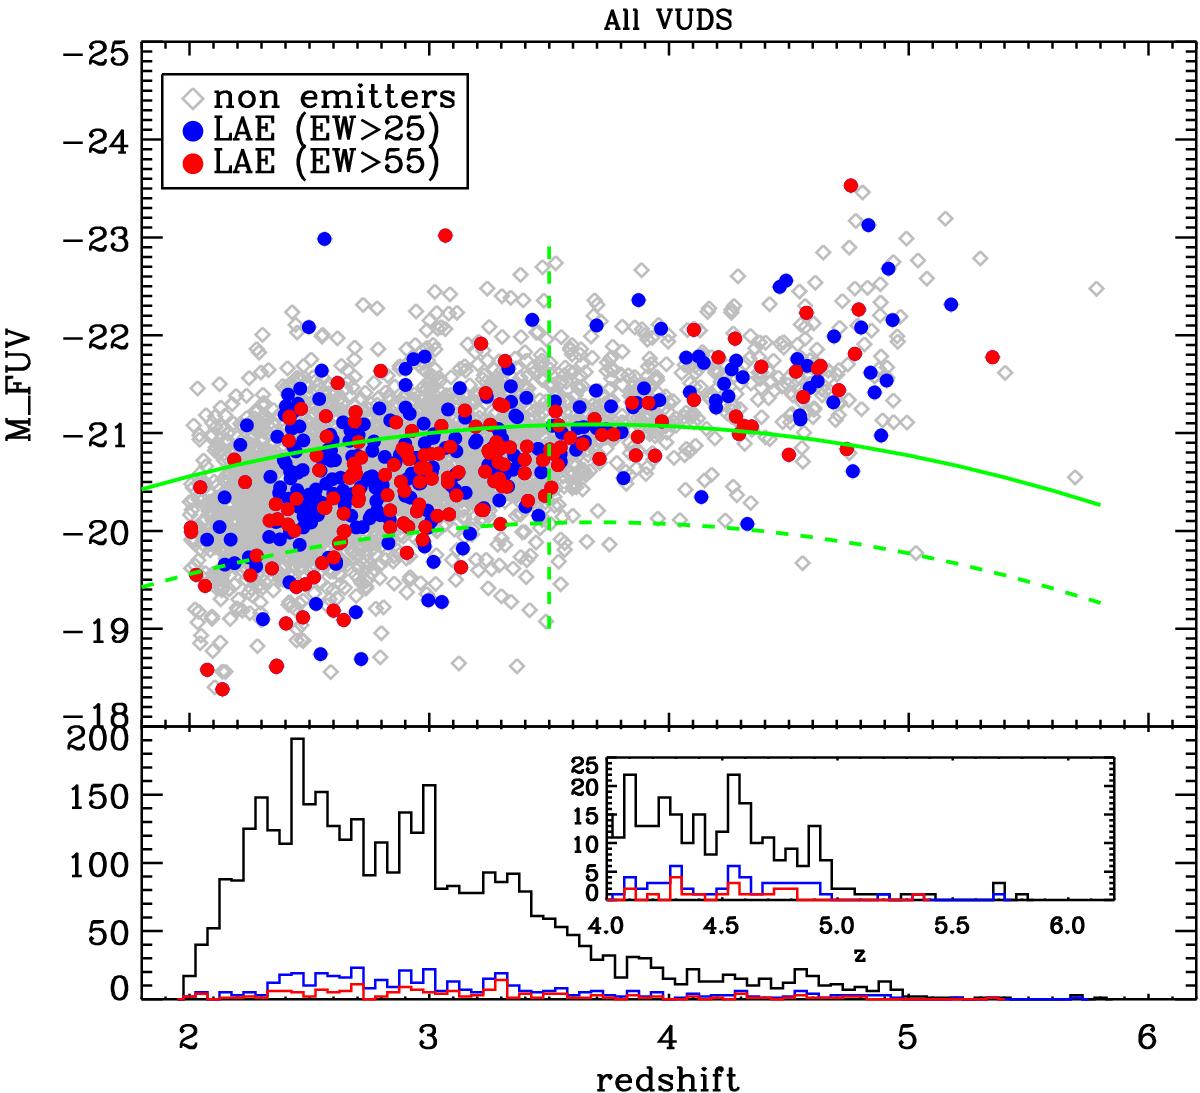
Top panel: absolute magnitude in the far-UV band as a function of the redshift, for all VUDS galaxies at 2 <z< 6 (gray diamonds), for the galaxies with EW0> 25 Å (blue circles) and for the galaxies with EW0> 55 Å (red circles). The green continuous curve indicates the evolving M∗ as a function of the redshift as derived from the compilation by Hathi et al. (2010); the dashed green curve indicates M∗ + 1. The vertical dashed line shows z = 3.5, the redshift up to which the faint sample is complete. Bottom panel: redshift distribution of the all the VUDS galaxies at 2 <z< 6 (black line) and of the VUDS galaxies with EW0> 25 Å (blue histogram) and EW0> 55 Å (red histogram).
Current usage metrics show cumulative count of Article Views (full-text article views including HTML views, PDF and ePub downloads, according to the available data) and Abstracts Views on Vision4Press platform.
Data correspond to usage on the plateform after 2015. The current usage metrics is available 48-96 hours after online publication and is updated daily on week days.
Initial download of the metrics may take a while.