Fig. 1
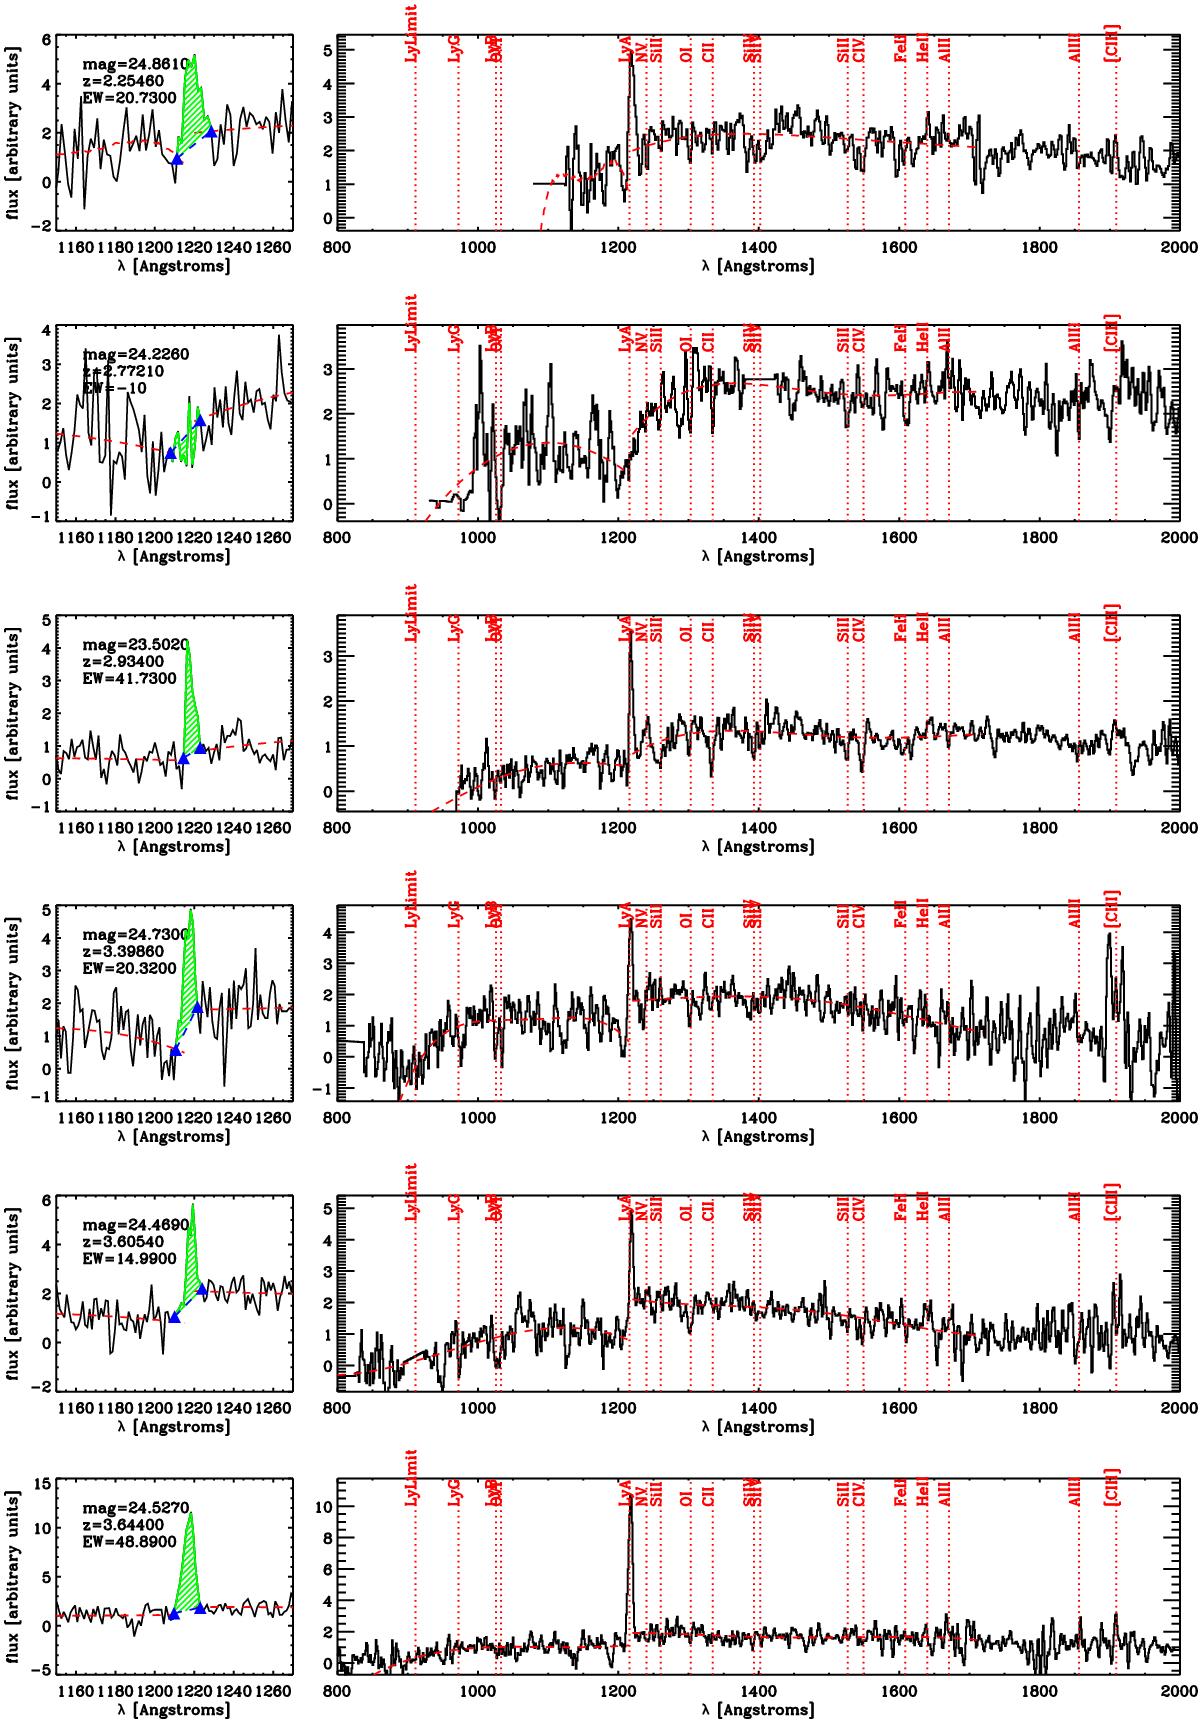
Six examples of spectra for the galaxies in the sample. The left panels show the region around Lyα, while the right ones show the full spectrum, with the most common UV rest-frame lines highlighted in red. These examples are chosen to be representative of the i-band magnitudes, redshifts and Lyα equivalent widths covered by the sample presented in this work. The red dashed curves show polynomial fits to the continuum: for each spectrum, the region between 912 Å and Lyα and the region between Lyα and 2000 Å are fitted separately. We note that the fits are not used at all in the analysis presented in this paper; they only provide a guidance to assess the continuum around Lyα. The blue triangles show the points on the continuum bracketing the Lyα line, shown in green.
Current usage metrics show cumulative count of Article Views (full-text article views including HTML views, PDF and ePub downloads, according to the available data) and Abstracts Views on Vision4Press platform.
Data correspond to usage on the plateform after 2015. The current usage metrics is available 48-96 hours after online publication and is updated daily on week days.
Initial download of the metrics may take a while.