Fig. 8
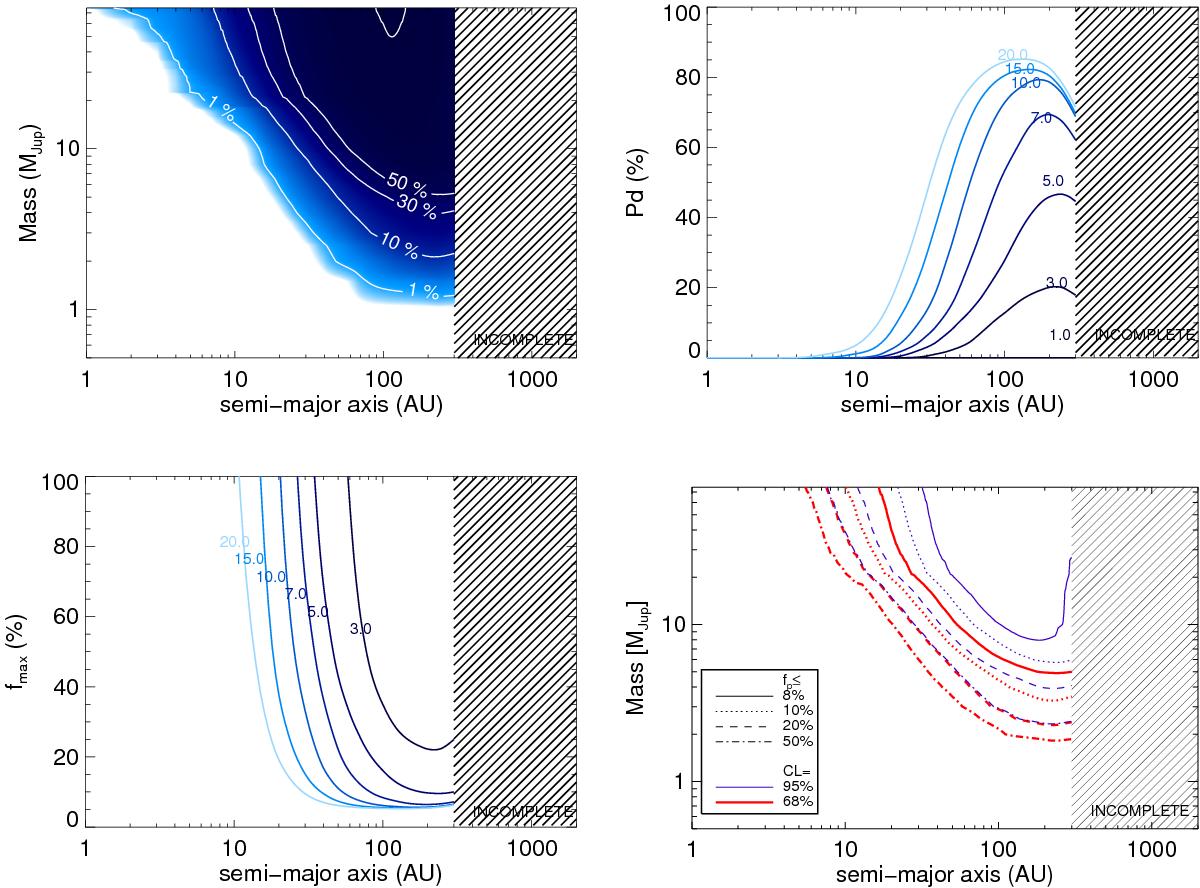
Results for the complete-stat sample. Top left: NaCo-LP mean detection probability map (⟨ pj ⟩) as a function of the mass and semi-major axis. Top right: mean probability curves for different masses (1, 3, 5, 7, 10, 15, and 20 MJup) as a function of the semi-major axis. Bottom left: giant planet and brown dwarf occurrence upper limit (fmax), considering a 95% confidence level, for different masses (3, 5, 7, 10, 15, and 20 MJup) as a function of the semi-major axis considering the null-detection result and an uniform distribution of planets and brown dwarfs in terms of masses and semi-major axis. Bottom right: same occurrence upper limit (fmax) expressed this time in a mass versus semi-major axis diagramme for a 68% and 95% confidence level (following Biller et al. 2007; Nielsen et al. 2008 representation).
Current usage metrics show cumulative count of Article Views (full-text article views including HTML views, PDF and ePub downloads, according to the available data) and Abstracts Views on Vision4Press platform.
Data correspond to usage on the plateform after 2015. The current usage metrics is available 48-96 hours after online publication and is updated daily on week days.
Initial download of the metrics may take a while.