Fig. 2
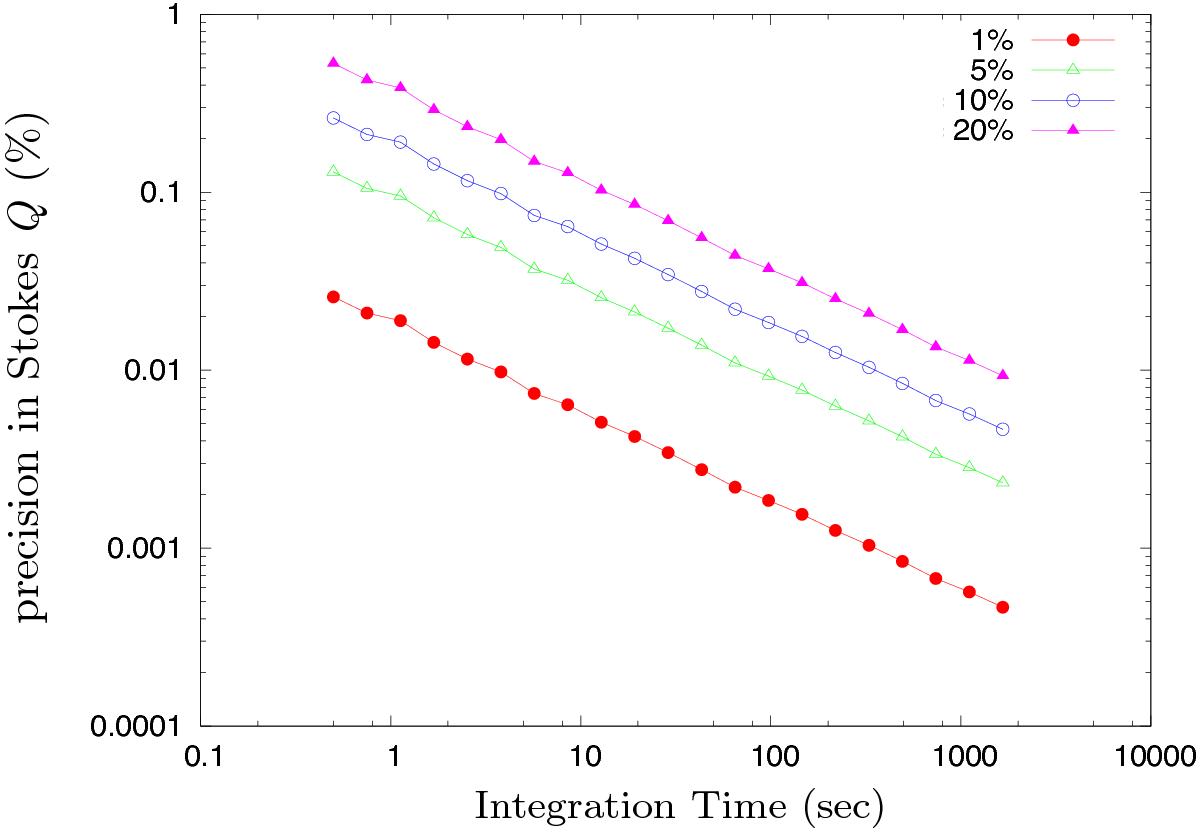
Simulations of polarimetric precision in degree of polarization for Stokes Q versus integration time. These simulations only consider the effects caused by variability in fiber transmission. These results were obtained from 500 iterations, where we used four different values for the uncertainty in fiber transmission (δT), 1%, 5%, 10%, and 20%, as indicated in the legend.
Current usage metrics show cumulative count of Article Views (full-text article views including HTML views, PDF and ePub downloads, according to the available data) and Abstracts Views on Vision4Press platform.
Data correspond to usage on the plateform after 2015. The current usage metrics is available 48-96 hours after online publication and is updated daily on week days.
Initial download of the metrics may take a while.