Fig. 13
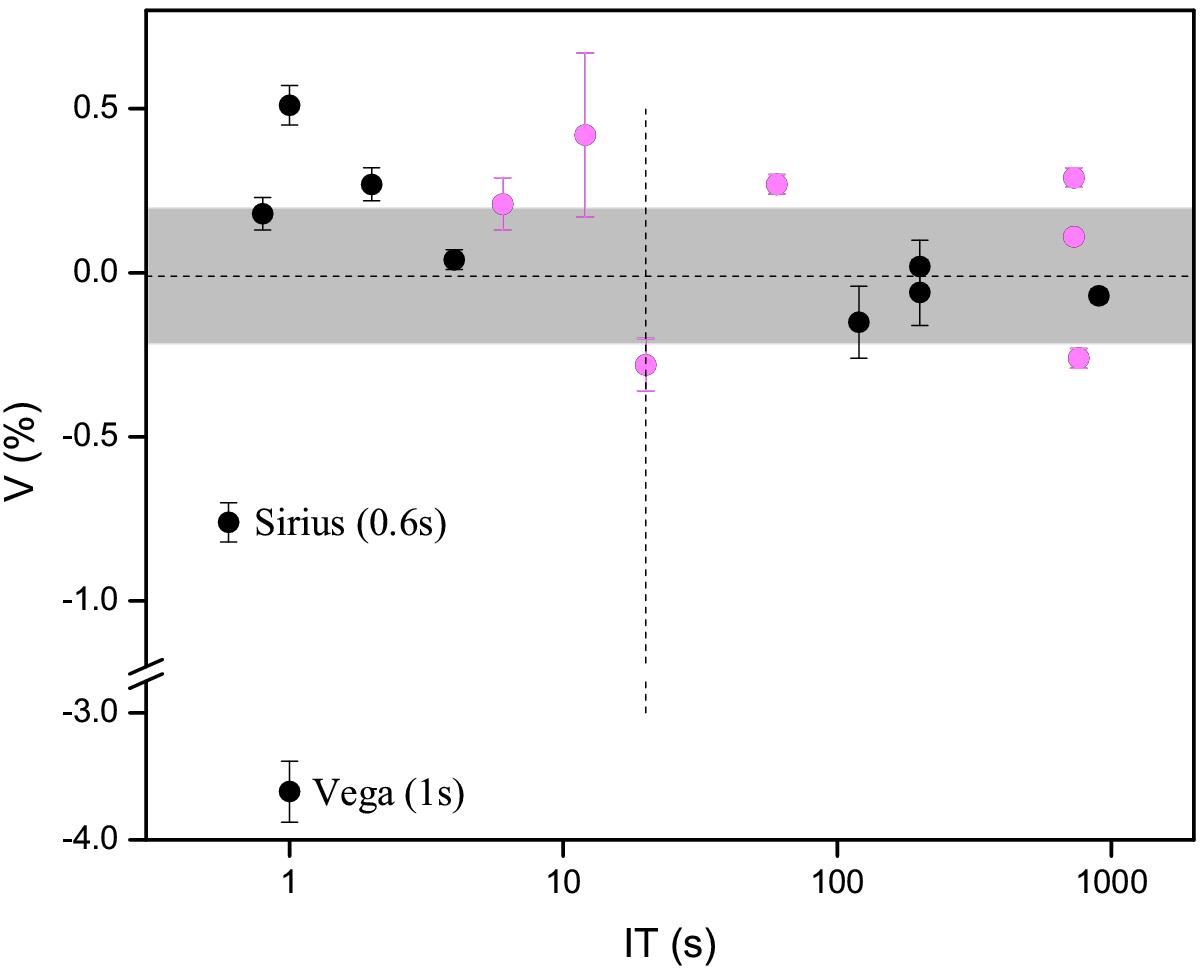
Synthetic circular polarization for selected objects from the CFHT archive. As in Fig. 12, the highest levels are shown. The gray zone indicates a one-sigma dispersion around the mean value: − 0.01 ± 0.21%, for objects with IT ≥ 20 s. This limit is indicated by a vertical dashed line. The objects measured using the old ADC (in 2006−2008 interval) are shown with magenta dots. The more recent measurements are shown with black dots.
Current usage metrics show cumulative count of Article Views (full-text article views including HTML views, PDF and ePub downloads, according to the available data) and Abstracts Views on Vision4Press platform.
Data correspond to usage on the plateform after 2015. The current usage metrics is available 48-96 hours after online publication and is updated daily on week days.
Initial download of the metrics may take a while.