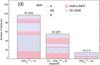
Fig. 9
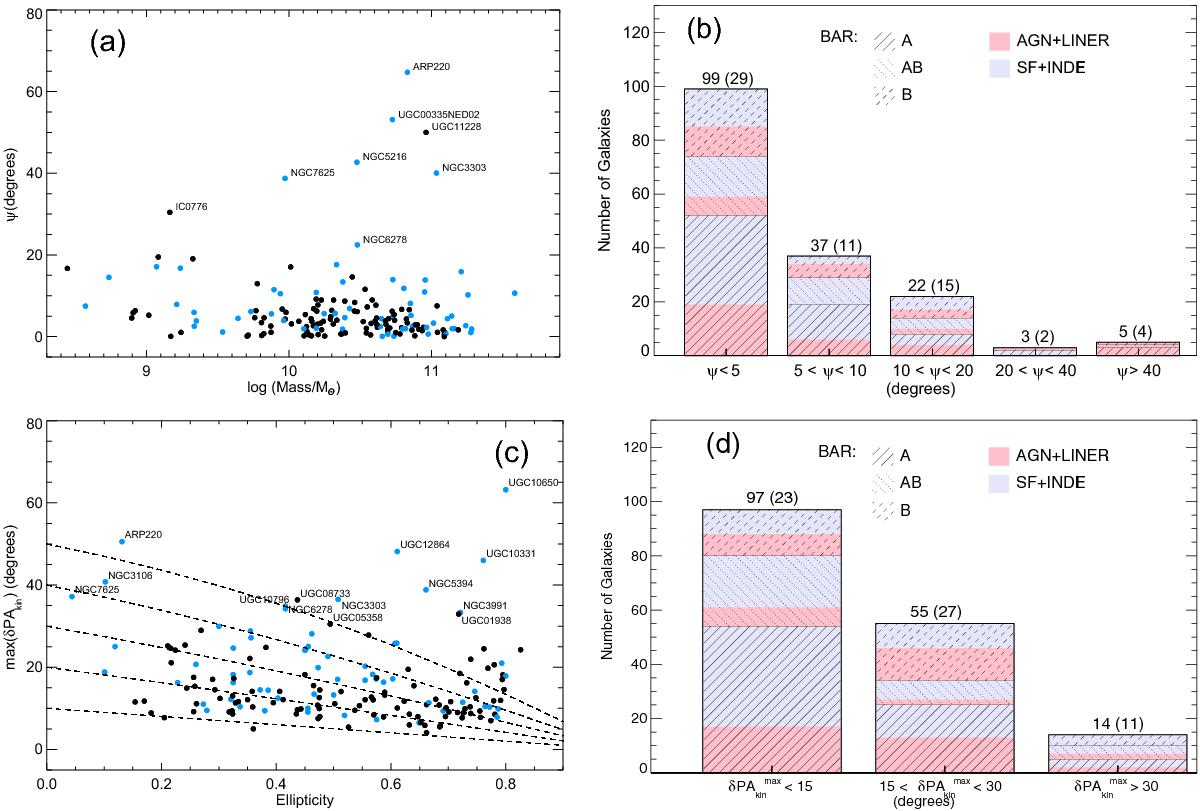
a) Misalignment (ψ) of the major kinematic position angles estimated from the receding (PAkin,rec) and approaching (PAkin,app) sides of the velocity fields for each galaxy as a function of the integrated stellar masses for the CALIFA galaxies in the sample (stellar masses are from Walcher et al. 2014). Labels indicate those objects with ψ> 20° degrees. Blue dots correspond to objects identified as galaxies in interaction (see Sect. 2.3 and Table A.1). b) Histogram of the kinematic misalignment of the major kinematic pseudo-axes estimated from the receding and approaching sides of the velocity fields. The fraction of non-barred and barred galaxies is indicated as in Fig. 1. Colors indicate here the nuclear type of the galaxies (AGN+LINER or SF+INDEF). Numbers indicate the total number of objects in each bin, including the number of interacting galaxies in parentheses. c) Largest standard deviation of the positions used to estimate the kinematic axes position angles (receding and approching sides) for each galaxy as a function of the ellipticity. Blue dots correspond to interacting galaxies. Labels indicate those objects with δPAkin> 30° degrees. Dashed lines draw the projection effects on δPAkin. d) Histogram of δPAkin. Colors and filled lines are the same as in b).
Current usage metrics show cumulative count of Article Views (full-text article views including HTML views, PDF and ePub downloads, according to the available data) and Abstracts Views on Vision4Press platform.
Data correspond to usage on the plateform after 2015. The current usage metrics is available 48-96 hours after online publication and is updated daily on week days.
Initial download of the metrics may take a while.