Fig. 8
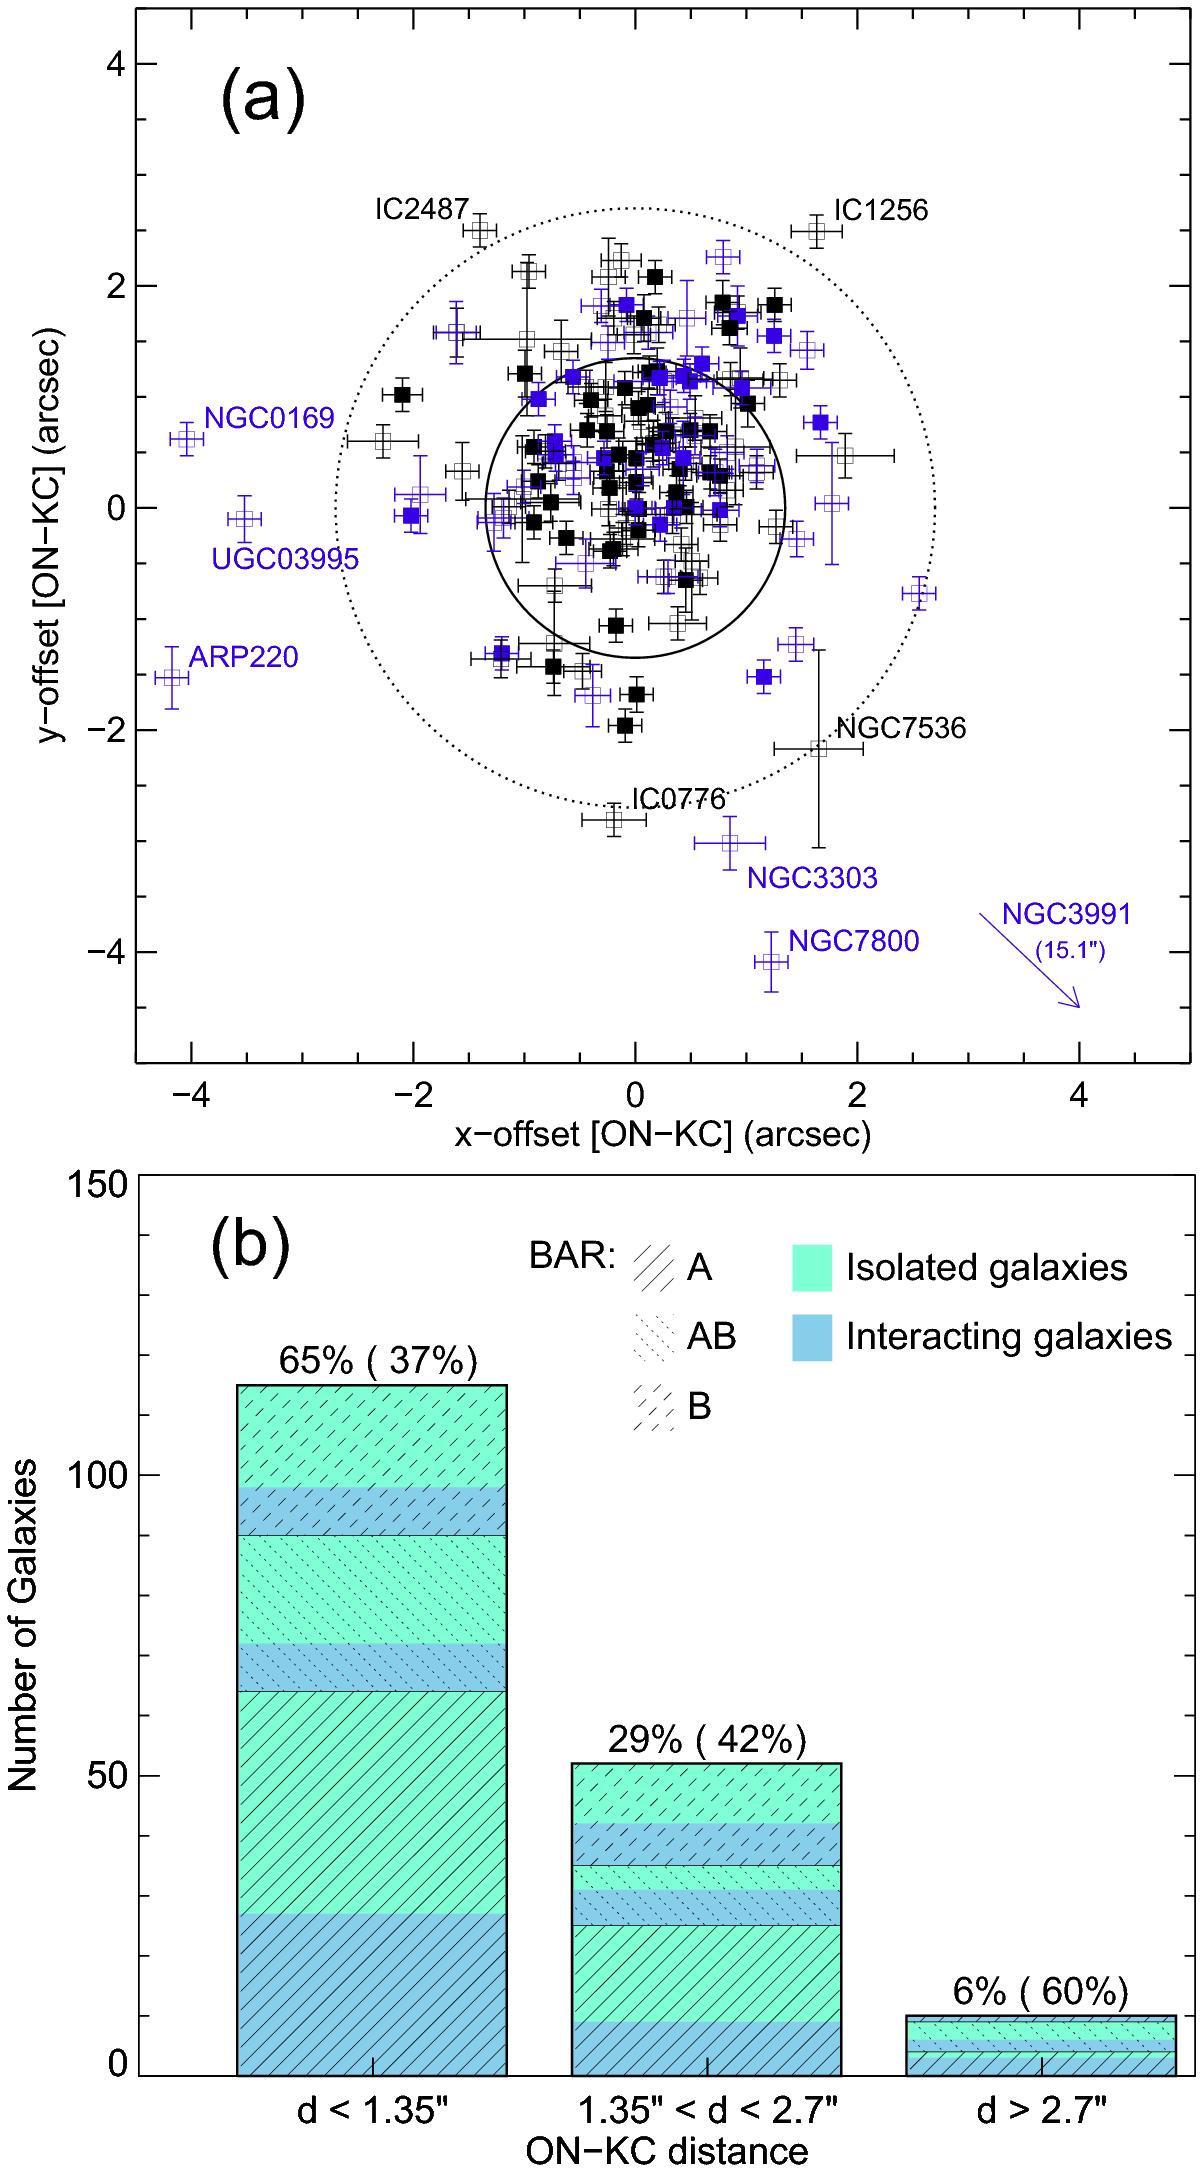
a) Location of the estimated KC positions relative to the CALIFA data cube central spaxel (optical nucleus location, see H13) for all the galaxies in the sample. Filled squares correspond to SGP galaxies, while open squares to MGP objects (see text). Those objects identified as galaxies in interaction (see Table A.2) are in blue. Labels correspond to objects with ON-KC offsets >2.7 arscec. The arrow points to the location of the ON-OK for NGC 3991, indicating its ON-KC offset in parentheses. The solid-line circle marks the size of the original spatial sampling (fiber size) of the CALIFA observations centered on the coordinate origin (optical nucleus location for each object, see H13). The dashed-line circle corresponds to twice the size of the original spatial element in CALIFA, which delimits the region between an offset (out of the dashed-circle) or possible offset (annular region between the solid-circle and the dashed-circle). b) Distribution of galaxies as a function of the distance (in arcsec) between ON and KC. Pattern styles and colors indicate bar and interacting status, respectively, as in Fig. 1. Numbers over each bin represent the fraction of objects of the sample in each bin. The relative fraction of interacting galaxies in each bin is indicated in parentheses.
Current usage metrics show cumulative count of Article Views (full-text article views including HTML views, PDF and ePub downloads, according to the available data) and Abstracts Views on Vision4Press platform.
Data correspond to usage on the plateform after 2015. The current usage metrics is available 48-96 hours after online publication and is updated daily on week days.
Initial download of the metrics may take a while.