Fig. 7
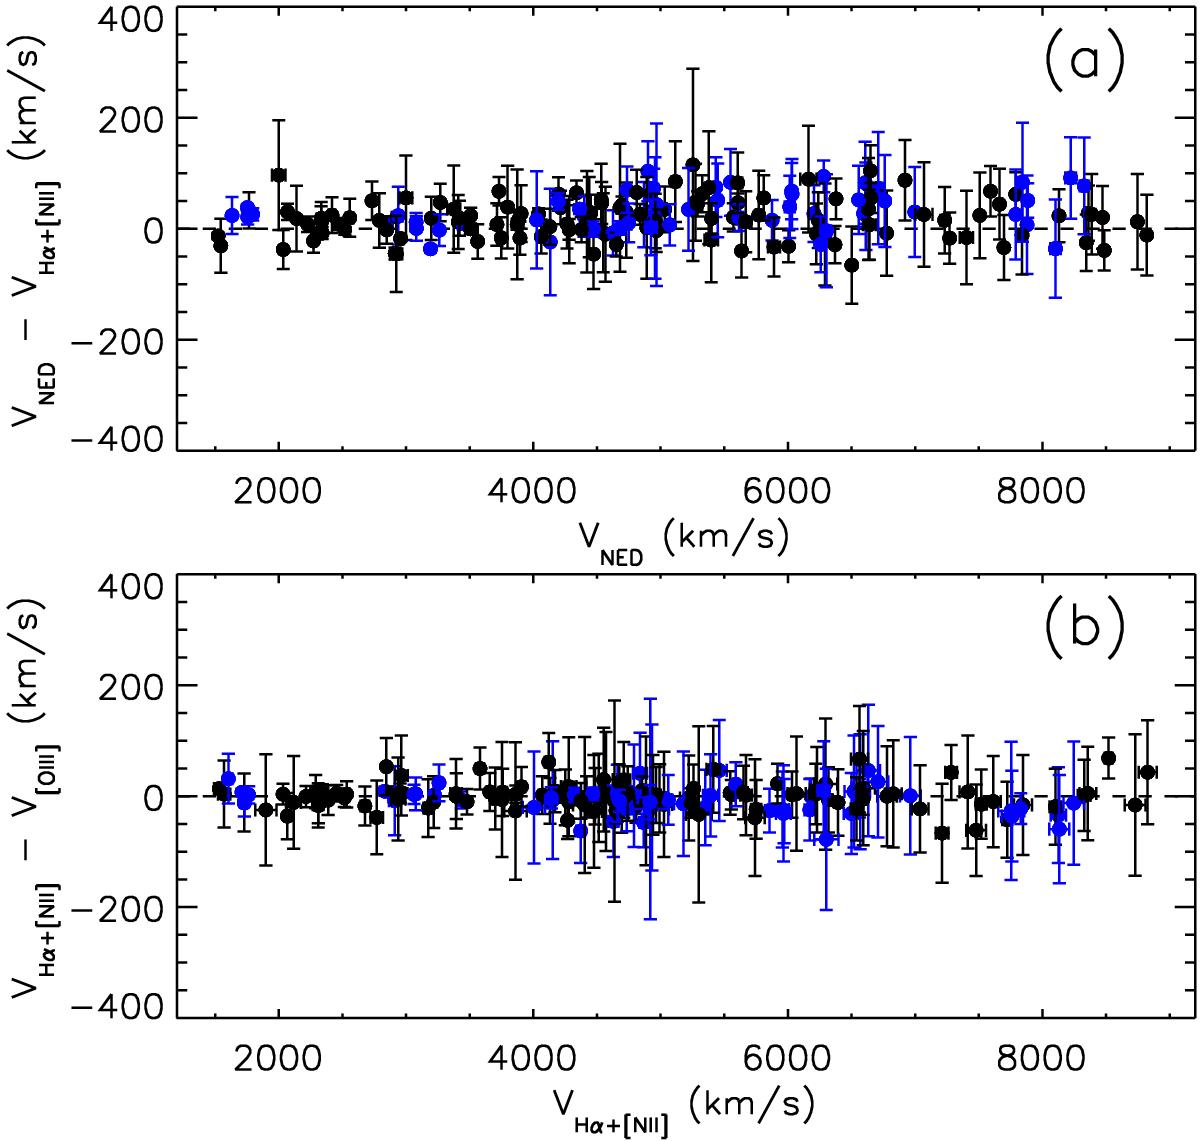
a) Comparison of the systemic velocities obtained from NED and those estimated from the Hα+[N ii] radial velocities (see Sect. 3.2.1) for the objects in the sample. Error bars in the horizontal axis correspond to the velocity uncertainties provided by NED. These velocity uncertainties and the standard deviation of the averaged radial Hα+[N ii] velocities of each object were combined to calculate the error bars for the vertical axis. b) Comparison of the systemic velocities derived from Hα+[N ii] and [O iii] emission lines for the objects in the sample. Error bars in the horizontal axis correspond to the standard deviation of the averaged radial velocities to estimate ![]() for each object. Error bars for the vertical axis were calculated from the standard deviation of Hα+[N ii] and [O iii] radial velocities. In both panels, blue dots correspond to objects identified as galaxies in interaction (see Sect. 2.3 and Table A.1)
for each object. Error bars for the vertical axis were calculated from the standard deviation of Hα+[N ii] and [O iii] radial velocities. In both panels, blue dots correspond to objects identified as galaxies in interaction (see Sect. 2.3 and Table A.1)
Current usage metrics show cumulative count of Article Views (full-text article views including HTML views, PDF and ePub downloads, according to the available data) and Abstracts Views on Vision4Press platform.
Data correspond to usage on the plateform after 2015. The current usage metrics is available 48-96 hours after online publication and is updated daily on week days.
Initial download of the metrics may take a while.