Fig. 6
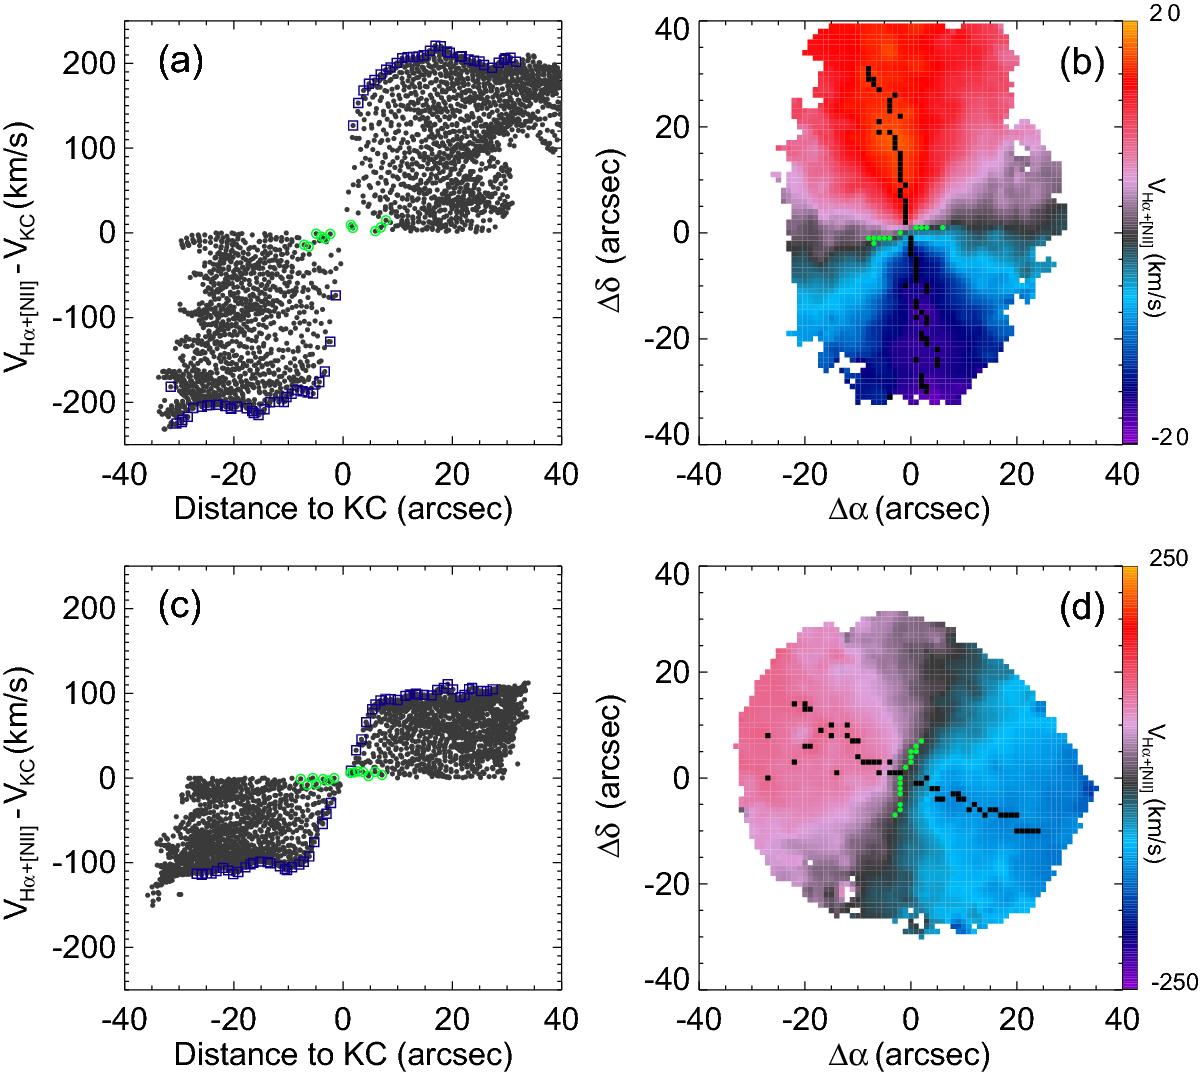
Left-panels: distance to the KC (in arcsec) versus the observed velocity for each spatial element of the CALIFA data cube for a)NGC 2347, and c)NGC 5947. The blue squares indicate those spaxels with the largest difference in velocity respect to the radial velocity of the KC at each radius, tracing a pseudo-rotation curve and defining a kinematic major axis. Green circles correspond to those spaxels with the lowest difference in velocity to the KC selected to estimate the PAminor. Right-panels: the ionized gas velocity field (from Hα+[N ii] following the procedure in 3) of b)NGC 2347, and d)NGC 5947. Filled squares mark the spaxels with the largest absolute velocity difference with the KC velocity at each radius – the same than those marked in blue open squares in a) and c). These spaxels trace the largest velocity gradient in the velocity field providing a direct estimation of the kinematic major axis position angle. Filled green circles correspond to those spaxels with a similar velocity than the KC – the same than green open circles in a) and c) – and tracing the kinematic minor axis.
Current usage metrics show cumulative count of Article Views (full-text article views including HTML views, PDF and ePub downloads, according to the available data) and Abstracts Views on Vision4Press platform.
Data correspond to usage on the plateform after 2015. The current usage metrics is available 48-96 hours after online publication and is updated daily on week days.
Initial download of the metrics may take a while.